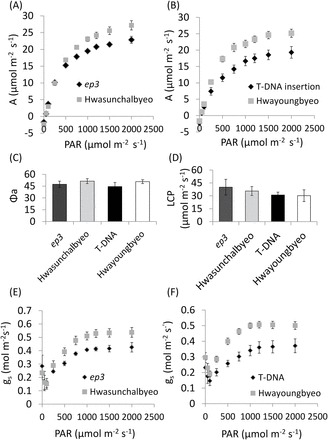
Fig. 3.

Light-response curve from fully expanded leaf 6 of ep3 mutants and their WT control plants. (A) A significant decrease of photosynthetic assimilation was found in ep3 NMU mutant plants compared with Hwasunchalbyeo over 500 µmol m–2 s–1 PAR, P <0.001 (paired t-test). (B) Significantly lower photosynthesis was also observed in the ep3 T-DNA insertion line compared with Hwayoungbyeo over 500 µmol m–2 s–1 PAR, P <0.001 (paired t-test). Analysis of apparent quantum yield (C) and light compensation point (D) indicate no significant change. (E, F) Stomatal conductance (g s) in response to PAR. Error bars in this figure show the SD, n=5.
