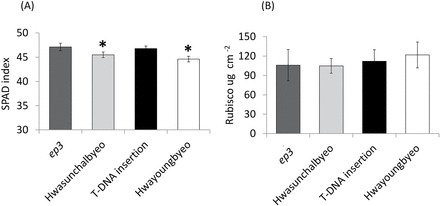
Fig. 4.

Analysis of SPAD index and Rubisco. Fully expanded leaf 6 from rice plants were used for these measurements. Error bars indicate SD value for n=3 in Rubisco and n=18 in SPAD. (A) SPAD index of mutant plants and WT control plants, indicating a proxy for chlorophyll content. (B) Analysis of Rubisco concentration per unit leaf area (µg cm–2).
