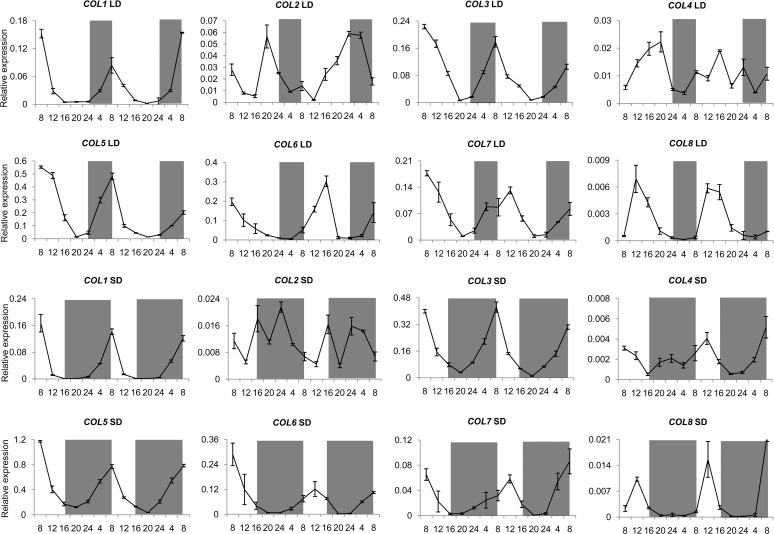
Fig 2. Diurnal expression patterns of eight COL genes in TM-1 leaves under LD or SD conditions.
The X-axin represent time point (hours) and Y-axin indicates relative expression levels with cotton histone3 (AF024716) as the control. Mean values ± SD were obtained from three biological repeats. The gray bars over each chart represent dark periods.

