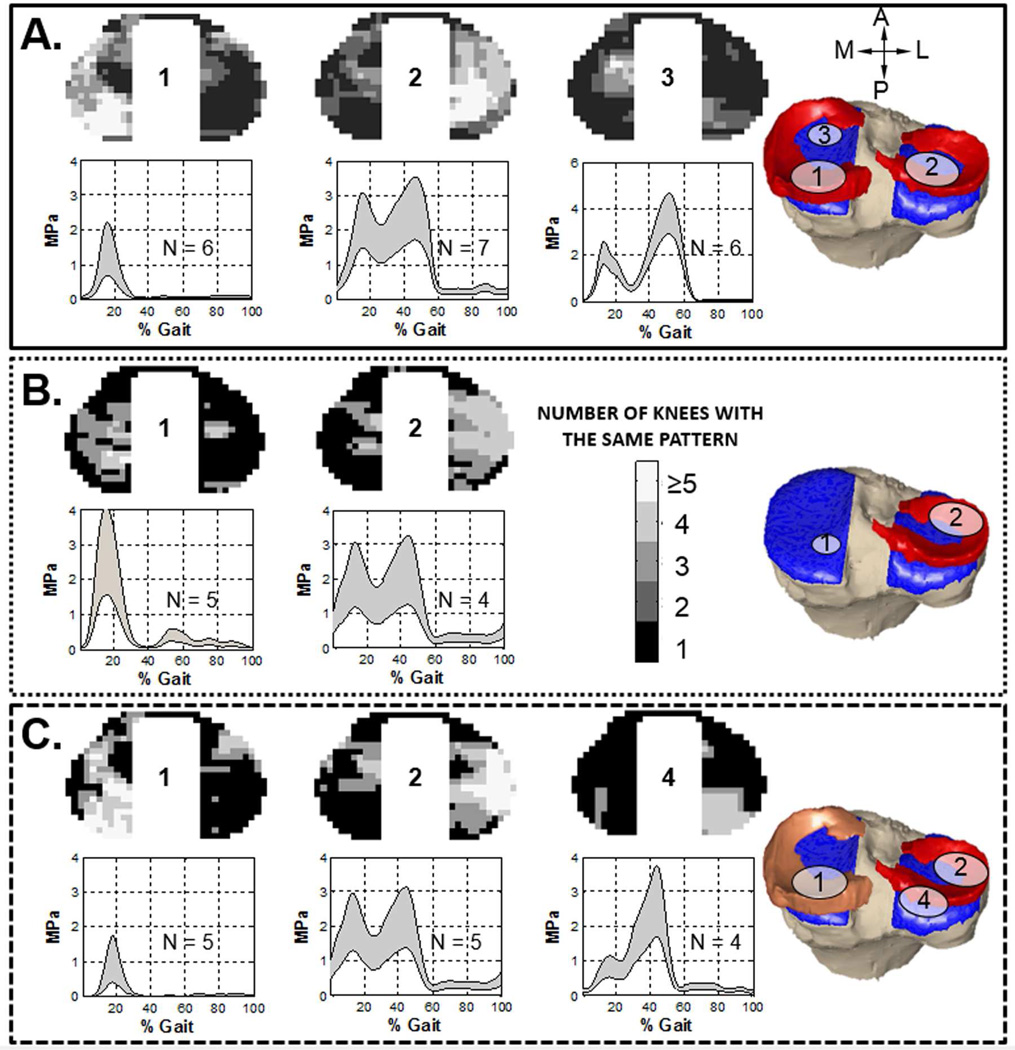
Figure 4.
The pattern distribution maps and loading profiles on the tibial plateau for the intact (A), medial meniscectomy (B), and meniscal transplanted (C) conditions. For the intact condition, three loading patterns were found. The greyscale color in pattern distribution map represented the number of knees that had the pattern in each area. The right-most illustration signified the region in which more than 75% of knees share this type of loading profile. The loading profile represented the weighted average (mean ± SD) of the contact stress within the pattern region during a gait cycle. The number of knees with each pattern was specified on the plot (i.e. N = 6). Pattern-3 was absent in both meniscectomy and meniscal transplanted conditions, while a new pattern (pattern-4) was found in meniscal transplanted condition.

