
Figure 2.
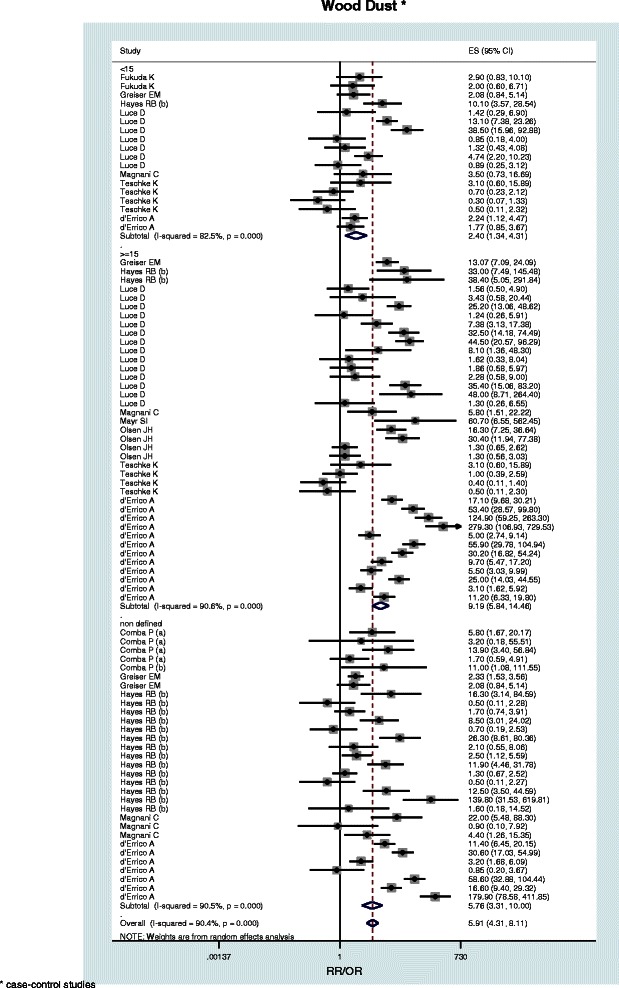
Forest plot of study-specific RRs and RRpooled(95% CIs), stratified by subgroups of exposure parameters for wood dust. The size of the squares reflects the statistical weight of the study in the meta-analyses.
Official websites use .gov
A
.gov website belongs to an official
government organization in the United States.
Secure .gov websites use HTTPS
A lock (
) or https:// means you've safely
connected to the .gov website. Share sensitive
information only on official, secure websites.
Forest plot of study-specific RRs and RRpooled(95% CIs), stratified by subgroups of exposure parameters for wood dust. The size of the squares reflects the statistical weight of the study in the meta-analyses.