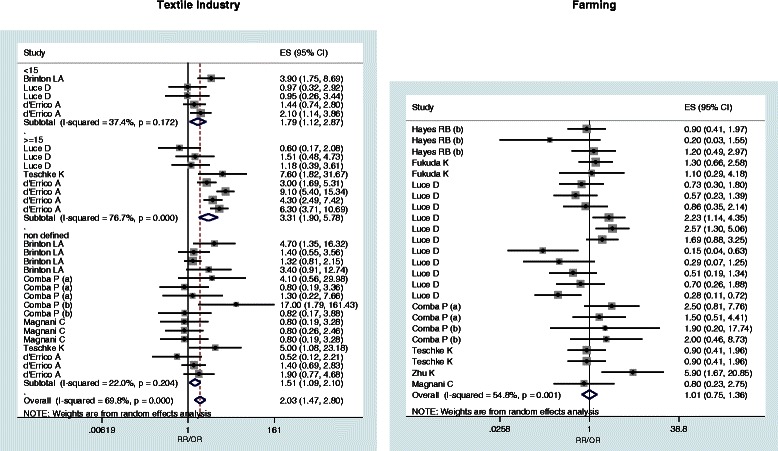
Figure 4.

Forest plots of study-specific RRs and RRpooled(95% CIs), stratified by subgroups of exposure parameters for textile industry and farming. The size of the squares reflects the statistical weight of the study in the meta-analyses.

Forest plots of study-specific RRs and RRpooled(95% CIs), stratified by subgroups of exposure parameters for textile industry and farming. The size of the squares reflects the statistical weight of the study in the meta-analyses.