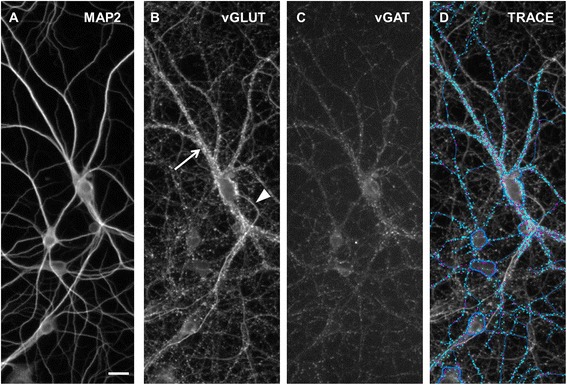
Figure 3.

Illustration of synaptogenesis high content imaging algorithm. All panels are matching images from the same field-of-view in a hippocampal culture at DIV 21. (A) MAP2 immunoreactivity is localized to the dendrites and cell body (note: axons are not immunoreactive for MAP2). (B) Cultures immunostained for vGLUT1 exhibit two patterns of vGLUT1 immunolabeling: punctuate labeling along dendrites (arrow) and continuous low intensity labeling along MAP2 immunonegative axons (arrowhead). (C) Inhibitory synapse labeling with vGAT. (D) MAP2 immunopositive cell bodies are masked (dark blue shapes) and MAP2 immunopositive dendrites emanating from selected cell bodies are traced (blue lines). Excitatory (teal) and inhibitory (purple) synaptic puncta are only quantified if they contact a dendrite or are contained within the cell body mask. Scale bar = 25 μm.
