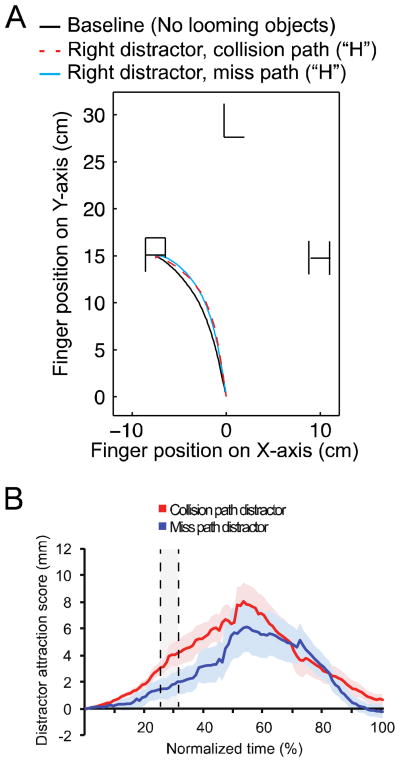
Figure 5.
Results from looming distractor trials of Experiment 2A. A) Mean movement trajectory averaged across all participants for trials where the target was at the left location, and either no distractor loomed (black line) or a distractor loomed at the right location either on a collision path (red dashed line) or on a miss path (blue line) from the participant. Distractor attraction scores reflect the difference between these two lines at each point averaged across all configurations. B) Distractor attraction scores throughout the resampled movement from Experiment 2A as a function of whether the looming distractor loomed on a collision path (red line) or a miss path (blue line) from the participant are plotted. There was more attraction of the hand towards distractors when they were on a collision path with the participant, indicated by a higher distractor attraction score early in the movement (shaded gray area between dashed lines). All error bars reflect S.E.M.

