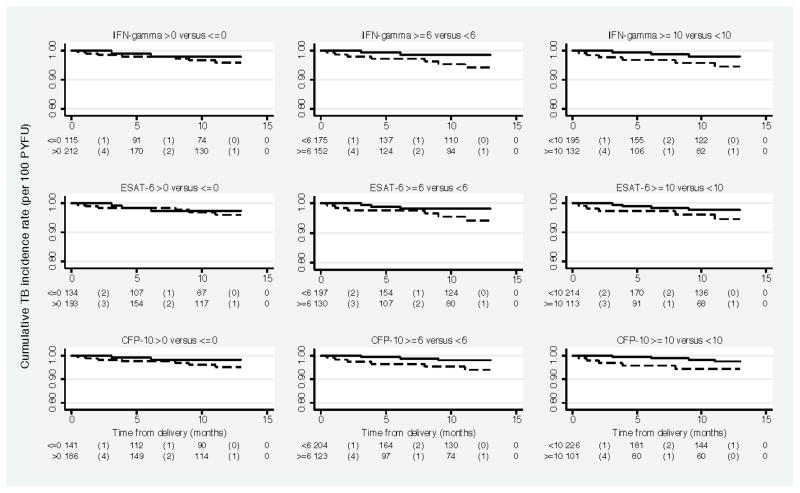
Figure 2.
Kaplan Meier estimates of cumulative tuberculosis incidence rate in HIV-1 infected women between delivery and 1 year postpartum by various cut-points in combined interferon-γ response and response to individual antigens, measured during pregnancy.
Note: In each plot, dashed line represents the survival curve for women below the cut-off value and bold line represents the survival curve for women above the cut-off value. The risk table shown below each plot shows the number at risk (number of events) within each time interval represented on the x-axis.
p-values for Log-rank test for equality of survival functions at each of the cut-off values displayed were >0.05.

