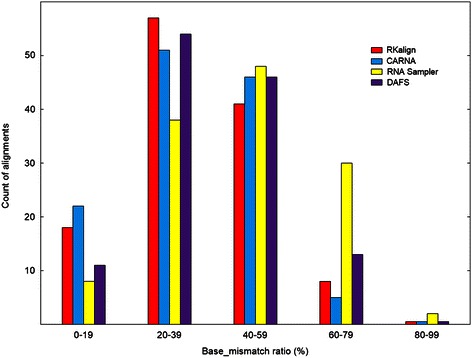
Figure 4.

Histogram for the base_mismatch ratios yielded by RKalign, CARNA, RNA Sampler and DAFS. Histograms for the base_mismatch ratios of the alignments produced by RKalign, CARNA, RNA Sampler and DAFS respectively on the 124 structure pairs selected from Dataset2. Buckets on the x-axis are defined by equal-width ranges 0 to19, 20 to 39, 40 to 59, 60 to 79, and 80 to 99 (rounded down to the nearest whole number). These histograms show the distribution of the base_mismatch ratios of the alignments produced by the four tools.
