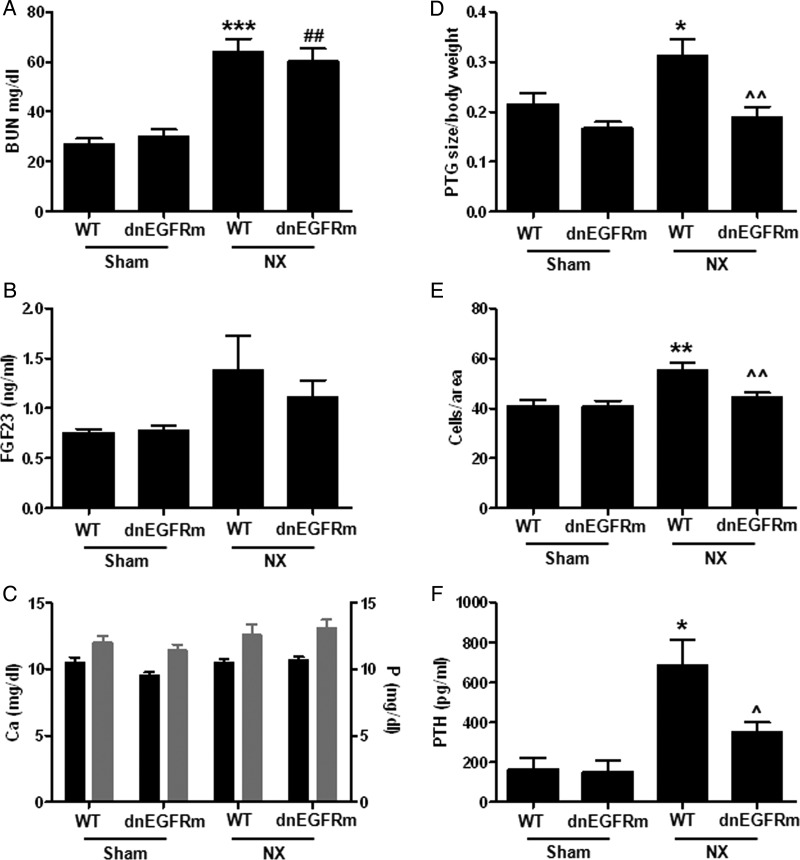
FIGURE 2:
Parathyroid-specific EGFR inactivation prevents parathyroid hyperplasia upon NX. Bars and error bars represent the mean and SEM of serum BUN (A, r2 = 0.50), FGF23 (B, r2 = 0.24) calcium (black bars) and phosphate (gray bars) (C, r2 = 0.26 and 0.19, respectively), parathyroid gland volume/body weight (D, r2 = 0.42), cell number per PTG area (E, r2 = 0.62) and serum PTH (F, r2 = 0.55) in WT and dnEGFRm mice after 14 weeks of either 75% NX or sham operation. *, ** or *** indicate P < 0.05, P < 0.01 or P < 0.001 versus sham WT; ## indicates P < 0.01 versus sham dnEGFRm; ^ and ^^ indicate P < 0.05 and P < 0.01 versus NX WT and r2 measures the goodness of fitness using the linear regression model described in ‘Materials and methods’ section. No significant interaction between NX and the transgene was found. Sham WT: n = 5; sham dnEGFRm: n = 3; NX WT: n = 11 and NX dnEGFRm: n = 10, where n is the number of mice and also the number of parathyroid glands examined.

