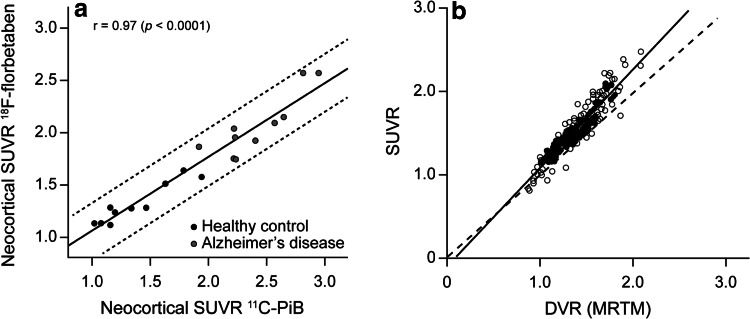
Fig. 2.
18F-florbetaben binding can be accurately quantified by PET imaging. Intra-individual comparison between 18F-florbetaben and the gold standard amyloid PET tracer (11C-PIB). Standardized uptake value ratios (SUVRs) showing close positive, linear correlation (a), and between 18F-florbetaben SUVRs and distribution volume ratios (DVRs) as obtained by the gold standard method to quantify PET tracer binding (full kinetic modeling, in this case performed using the multilinear reference tissue model [MRTM]), again showing a close positive linear correlation (b). a Reproduced from Ref. [19] ©2013 BMJ Publishing Group Ltd. b This research was originally published in Ref. [24], copyright by the Society of Nuclear Medicine and Molecular Imaging, Inc

