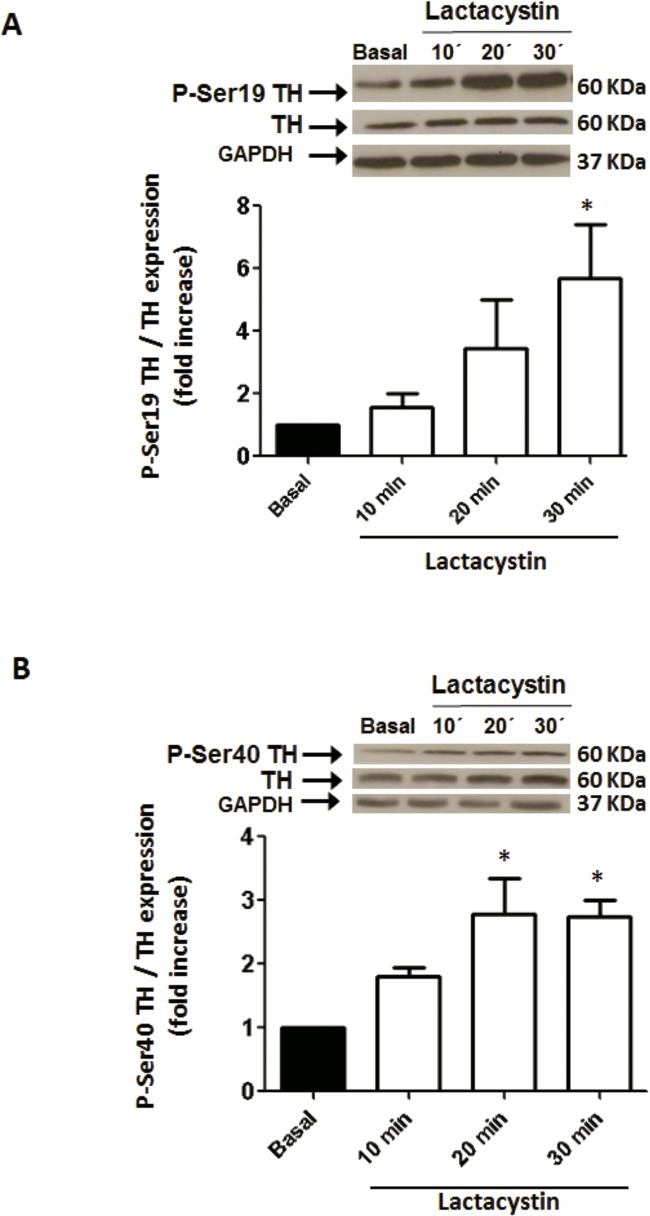
Fig 4. Effect of proteasome inhibition on TH phosphorylation at Ser19 (A) and Ser40 (B).
PC12 cells were exposed to 1 μmol/L lactacystin at different times and TH-phospho Ser19 or TH-phospho Ser40 were measured by Western-blot as described in Methods and normalized to TH protein level in the same sample. Protein loading was evaluated by reblotting the membrane with anti-GAPDH antibody and no differences were observed in any of the conditions assayed. Each bar represents the mean ± SEM of 3 determinations from four separate cell culture preparations. * P < 0.05 as compared to basal.

