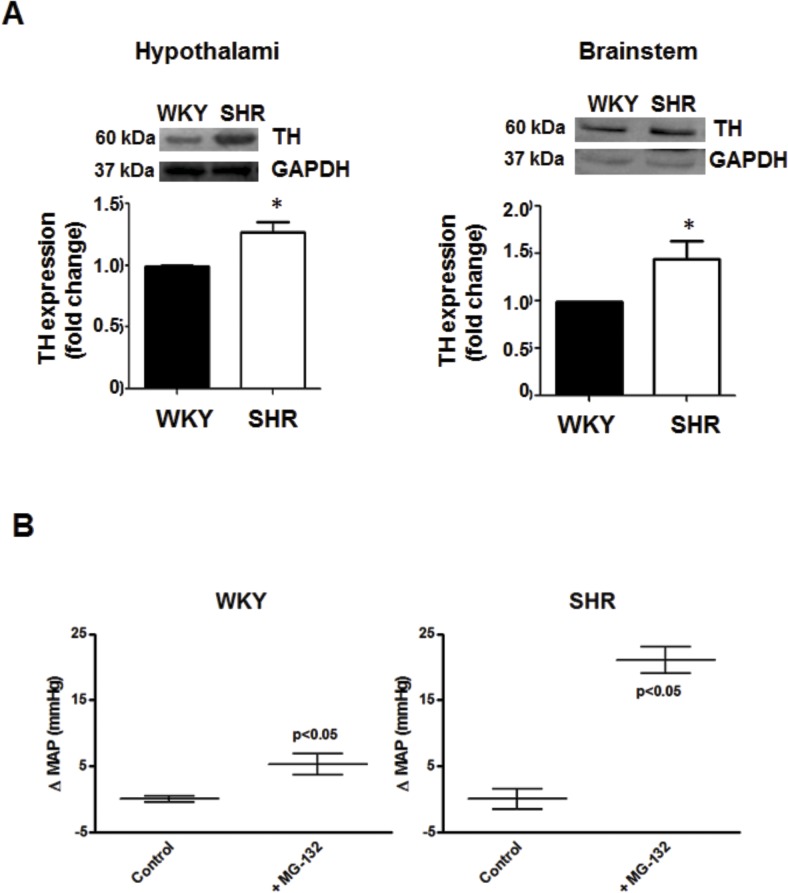
Fig 7. TH protein level in the hypothalamus and brainstem of WKY or SHR rats.
A, TH protein level was assessed by Western-blot as described under Methods. Blots were stripped and reprobed for GAPDH to assess protein loading. Signals from TH protein level were normalized to GAPDH levels. Each bar represents the mean ± SEM (n = 7). * P < 0.05 as compared to WKY. B, Change in mean arterial pressure (MAP) in WKY and SHR after intracerebroventricular injection of aCSF (control) or the proteasome inhibitor MG-132. Values are mean ±SEM (n = 7). * P < 0.05 as compared with basal.

