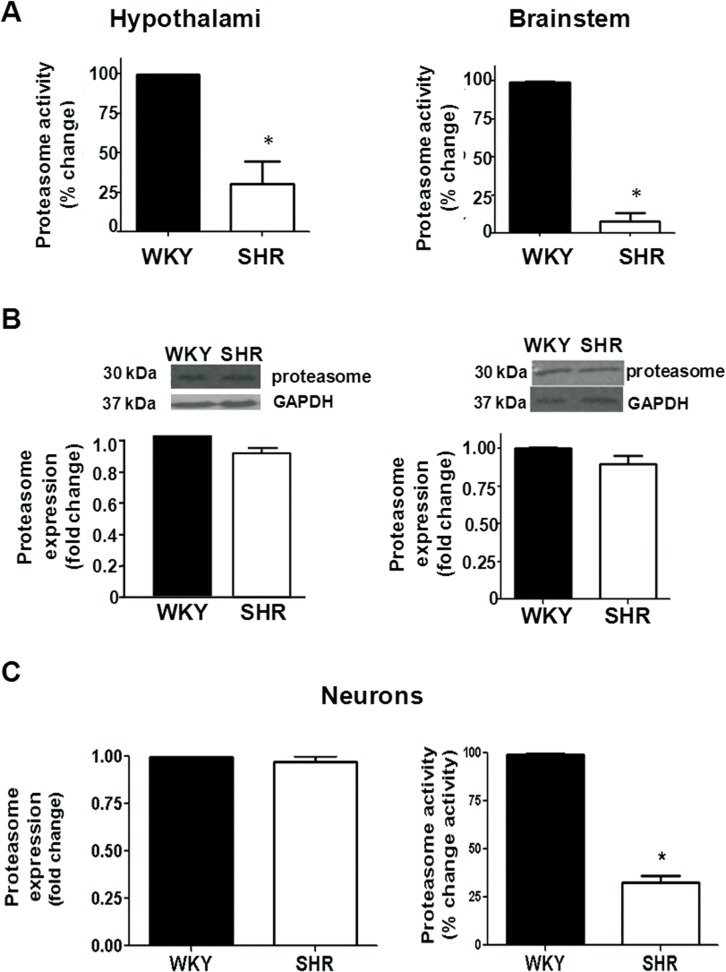
Fig 8. A, Proteasome activity in the hypothalamus and brainstem of WKY and SHR rats.
Values are mean ±SEM (n = 7). * P < 0.05 as compared with WKY. B, Proteasome protein level in the hypothalamus and brainstem, respectively, from WKY and SHR. Proteasome protein level was measured by Western-blot as described under Methods. Blots were stripped and reprobed for GAPDH to assess protein loading. Signals from proteasome protein level were normalized to GAPDH levels. Values are mean ±SEM (n = 7). * P < 0.05 as compared to WKY. C, Proteasome protein level and activity in neuronal cultures from the hypothalamus and brainstem of WKY and SHR rats. Values are mean ±SEM of 3 determinations from three separate cell culture preparations. * P < 0.05 as compared with WKY.

