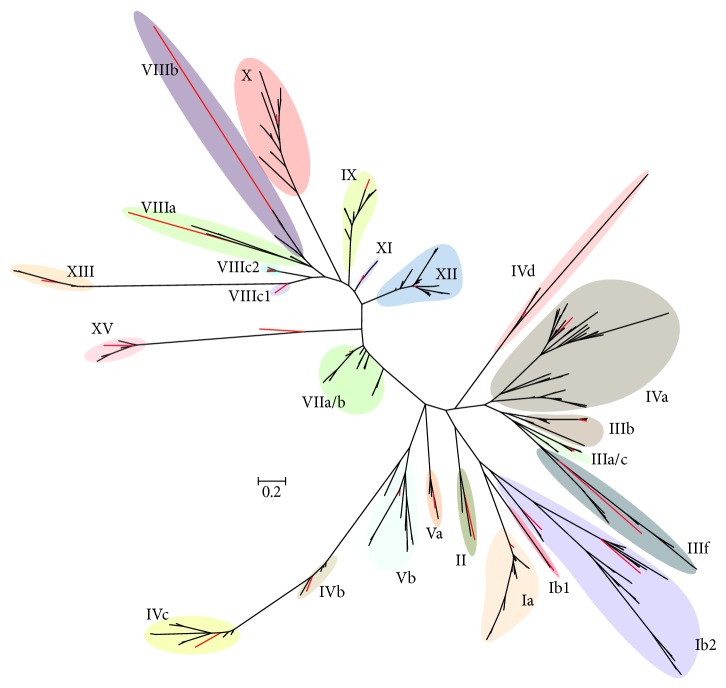
Figure 3.
Maximum likelihood phylogenetic tree of soybean bHLH gene families. A radiation diagram is used to represent an unrooted maximum likelihood tree (highest scoring of 1052 bootstraps) with branch lengths proportional to estimated sequence distance. Colored balloons represent named bHLH families identified by sequence similarity to the families in Arabidopsis, and red branches represent Arabidopsis bHLHs included to identify the families. Scale bar represents 0.2 expected amino acid residue substitutions per site. A full version of this tree with individual bHLH sequence names and bootstrap support values can be found in Additional File 4.

