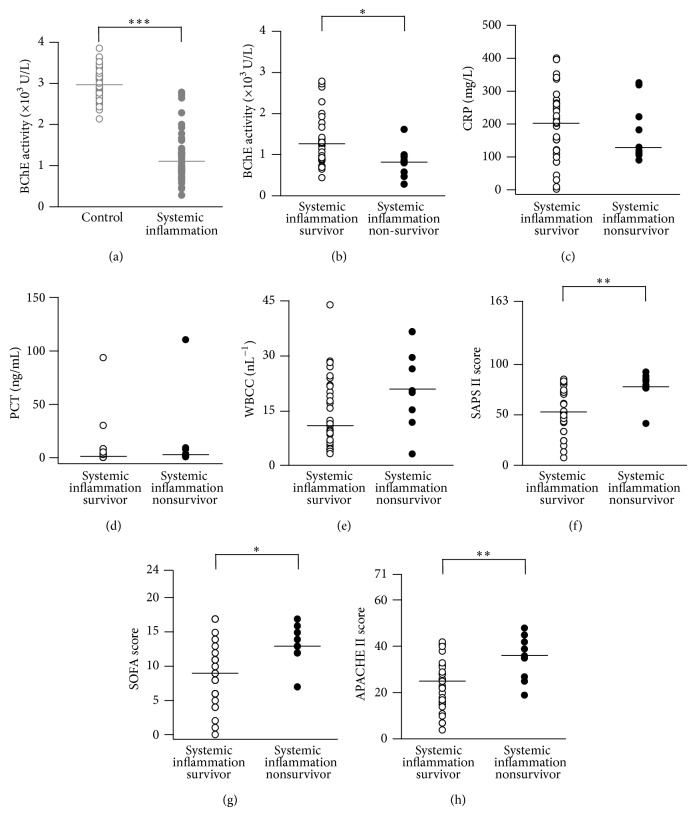
Figure 1.
Reduced BChE activity in patients with systemic inflammation. (a) Scatter plots represent results of BChE point-of-care-testing (POCT) obtained from healthy volunteers (gray open circles, control) and patients diagnosed with systemic inflammation (gray closed circles, see Table 1). (b) Based on subsequent 28-day-survival analysis, patients were further divided into the survivor and nonsurvivor subgroups (black open and closed circles, resp.). ((c)–(h)) Histograms represent concurrent measurements of inflammation biomarkers CRP (n = 40 measurements (c)), PCT (n = 34 measurements (d)) and WBCC (n = 40 measurements (e)) and disease severity scores (SAPS II, SOFA, and APACHE II, n = 40 measurements each (f), (g), and (h)) from survivors (open circles) and nonsurvivors (closed circles). Bars are median values. * P < 0.05, ** P < 0.01, and *** P < 0.001 (Mann-Whitney test). BChE: butyrylcholinesterase; CRP: C-reactive protein; PCT: procalcitonin; WBCC: white blood cell count; SAPS: simplified acute physiology score; SOFA: sequential organ failure assessment; APACHE: acute physiology and chronic health evaluation.

