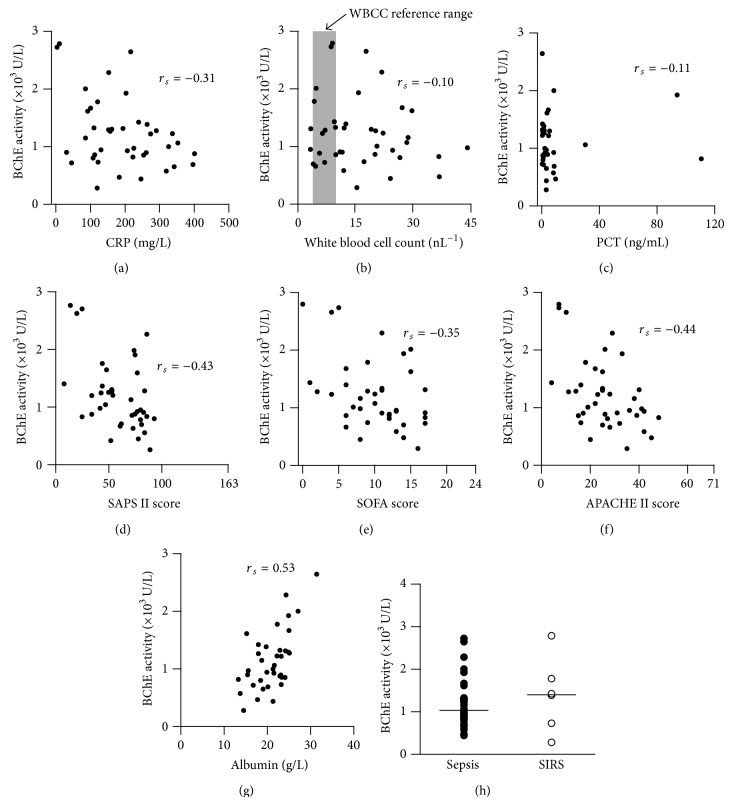
Figure 2.
BChE activity correlates with the severity of systemic inflammation. Scatter plots illustrate a correlation between BChE activity and CRP level (n = 40 measurements (a)) and white blood cell count (WBCC, n = 40 measurements) (b) measured from patients with systemic inflammation. Shaded box in diagram (b) denotes laboratory reference interval (healthy limits) used for the WBCC. The analysis revealed no correlation between BChE activity and PCT concentration (n = 34 measurements (c)). BChE activity inversely correlates with SAPS II (d), SOFA (e), and APACHE II (f) disease severity scores (n = 40 measurements each). Panel (g) indicates strong direct correlation between serum albumin level, a disease severity biomarker, and BChE activity obtained from patients with severe systemic inflammation (n = 40 measurements). Histogram (h) represents BChE activity measurements from patients with diagnosed sepsis (closed circles) and those with SIRS (inflammation without proven infection, open circles). Bars are median values. r s: Spearman correlation coefficient; SAPS: simplified acute physiology score; SOFA: sequential organ failure assessment; APACHE: acute physiology and chronic health evaluation; SIRS: systemic inflammatory response syndrome.

