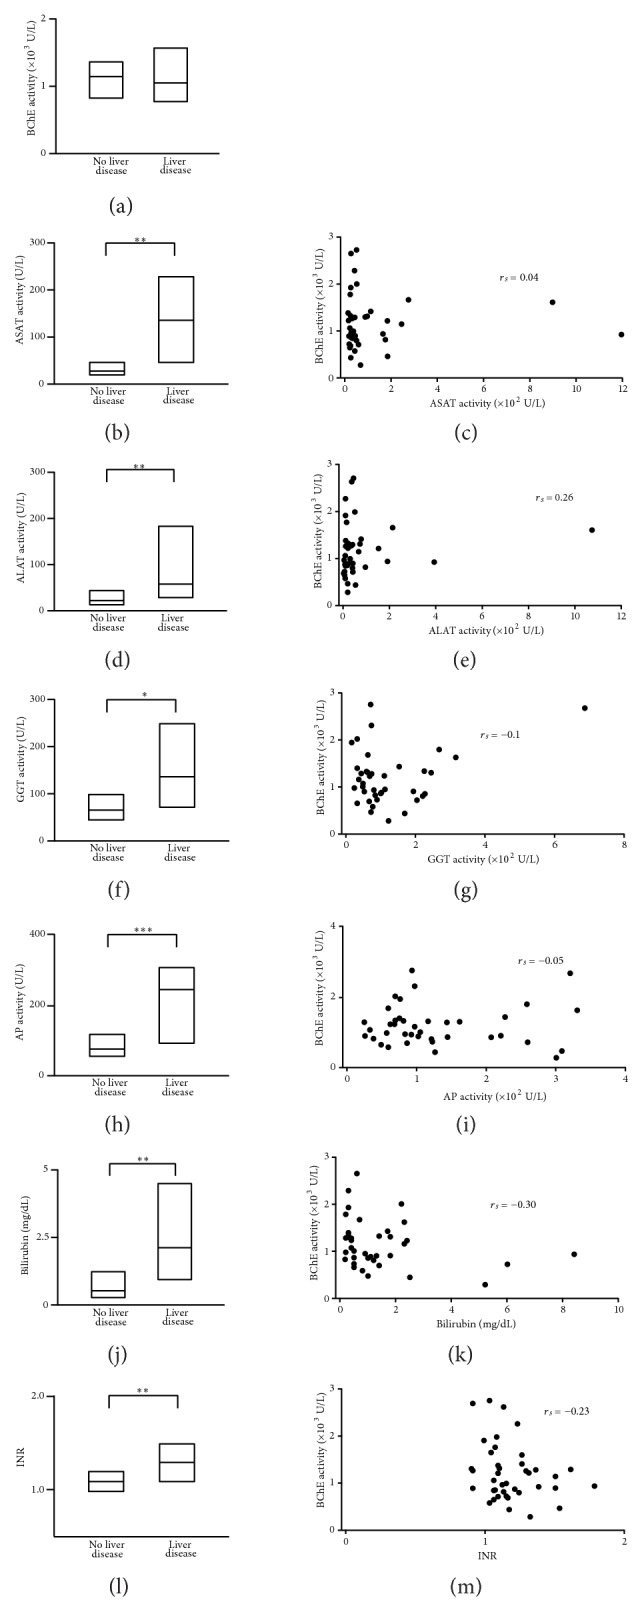
Figure 3.

POCT-measured BChE activity during systemic inflammation remains disrupted, independent of the patient liver function. Box plots represent median values and 25%–75% percentile of the POCT-measured BChE activity (n = 40 measurements (a)) and standard laboratory tests for ASAT (n = 39 measurements (b)), ALAT (n = 39 measurements (d)), GGT (n = 39 measurements, f), AP (n = 39 measurements (h)) activity, total serum bilirubin concentration (n = 38 measurements (j)), and INR coagulation test (n = 40 measurements (l)) in patients with systemic inflammation associated with (liver disease) or without (no liver disease) hepatic dysfunction. Scatter plots represent the correlation degree between POCT-measured BChE activity and the corresponding ASAT (c), ALAT (e), GGT (g), AP (i) activity, bilirubin concentration (k), and INR (m). ASAT: aspartate aminotransferase; ALAT: alanine aminotransferase; GGT: gamma glutamyl transpeptidase; AP: alkaline phosphatase; INR: international normalized ratio. * P < 0.05, ** P < 0.01, and *** P < 0.001 (Mann-Whitney test); r s: Spearman correlation coefficient.
