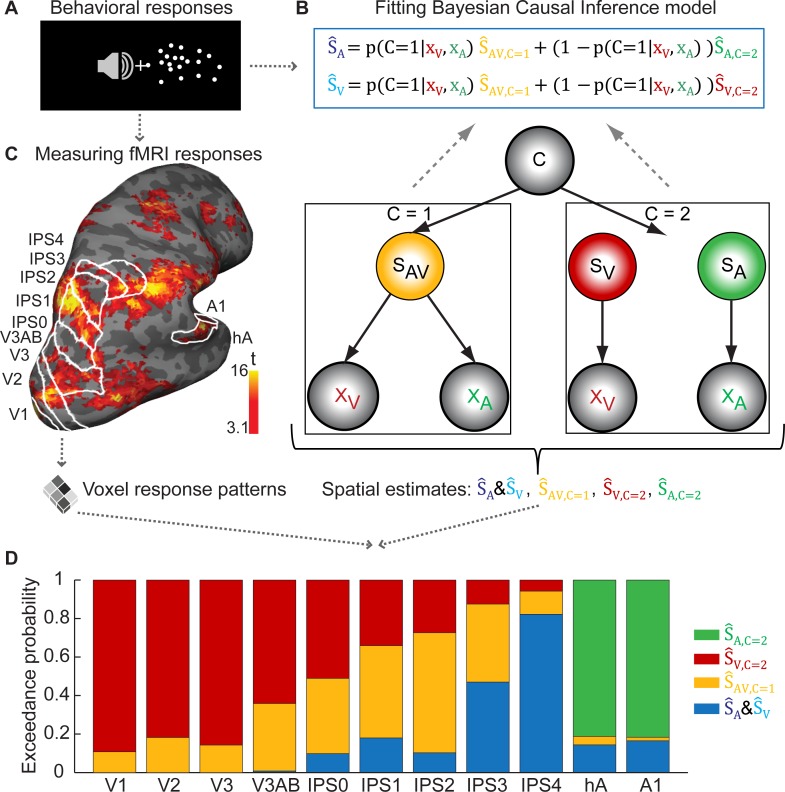
Fig 3. Bayesian Causal Inference model and cortical hierarchies.
(A) Participants were presented with auditory and visual spatial signals. We recorded participants’ psychophysical localization responses and fMRI BOLD responses. (B) The Bayesian Causal Inference model [2] was fitted to participants’ localization responses and then used to obtain four spatial estimates for each condition: the unisensory auditory (ŜA,C=2) and visual (ŜV,C=2) estimates under full segregation (C = 2), the forced-fusion estimate (ŜAV,C=1) under full integration (C = 1), and the final spatial estimate (ŜA, ŜV) that averages the task-relevant unisensory and the forced-fusion estimate weighted by the posterior probability of each causal structure (i.e., for a common source: p(C = 1|xA, xV) or independent sources: 1 − p(C = 1|xA, xV). (C) fMRI voxel response patterns were obtained from regions along the visual and auditory hierarchies (V, visual sensory regions; A1, primary auditory cortex; hA, higher auditory area; IPS, intraparietal sulcus). (D) Exceedance probabilities index the belief that a given spatial estimate is more likely represented within a region of interest than any other spatial estimate. The exceedance probabilities for the different spatial estimates are indexed in the length of the colored areas of each bar (n.b. the y-axis indicates the cumulative exceedance probabilities). The data used to make this figure are available in file S1 Data.

