
Figure 2.
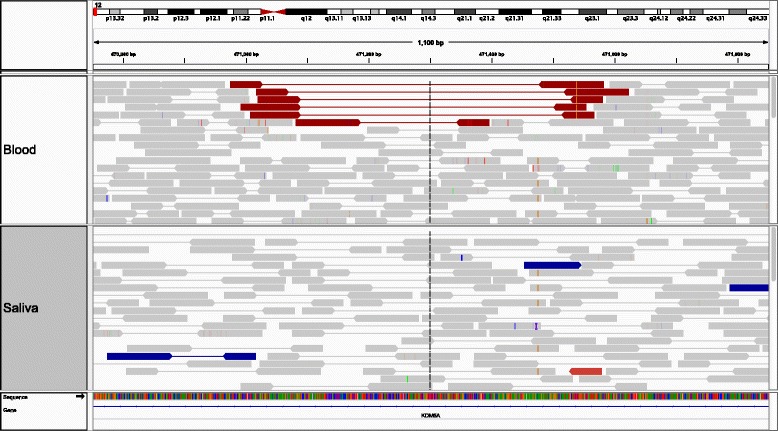
IGV snapshot of the alignments showing the deletion chr12:471,091-471,494 in the blood sample (top half of the plot) and the absence of the deletion in the saliva sample (bottom half of the plot).
Official websites use .gov
A
.gov website belongs to an official
government organization in the United States.
Secure .gov websites use HTTPS
A lock (
) or https:// means you've safely
connected to the .gov website. Share sensitive
information only on official, secure websites.
IGV snapshot of the alignments showing the deletion chr12:471,091-471,494 in the blood sample (top half of the plot) and the absence of the deletion in the saliva sample (bottom half of the plot).