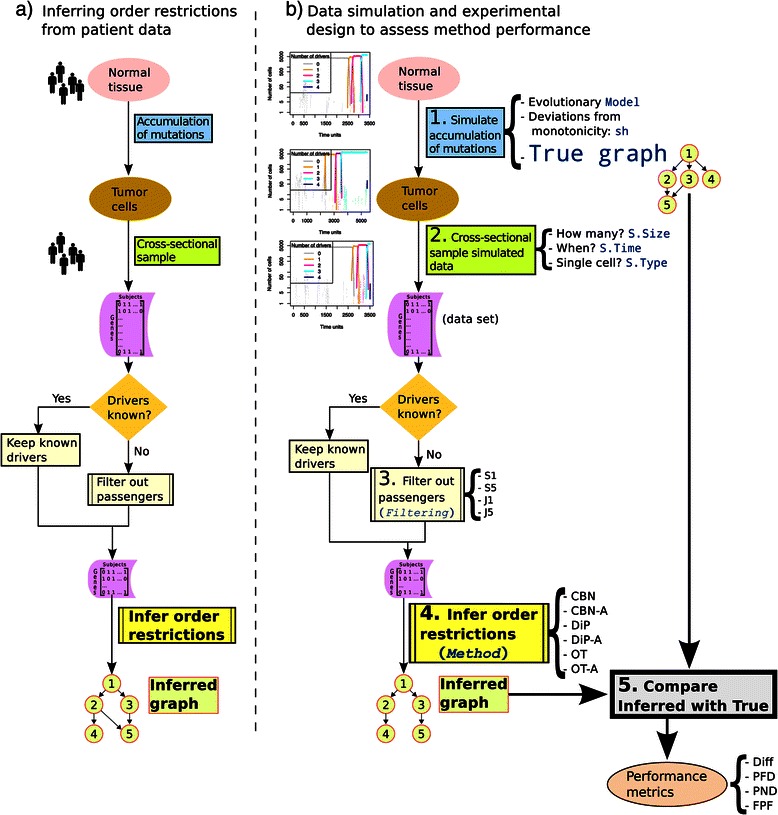
Figure 1.

Inferring order restrictions. (a) Main steps in the analysis of patient data. (b) Main steps used in this paper for the generation (simulation) of data and its analysis. Terms in monospaced blue font are those in Table 1, and terms in italics, as in Table 1, correspond to within-data set factors. Numbers indicate the chronological order of the steps. In step 1, cancer development is simulated for the specified values of Model, sh, and True Graph. This simulation generates tumor cell data for the equivalent of a single patient in panel (a). In step 2, data for S.Size patients are sampled (cross-sectional sampling) according to the settings of S.Time and S.Type, producing a data set (a collection of genotypes: a matrix of subjects by genes). If the identity of the true drivers is not known, Filtering in step 3 removes from the data set the genes that do not meet certain frequency criteria. The data set is then passed on, in step 4, to one of the specified methods to infer the graph that encodes the order restrictions. This inferred graph is compared, in step 5, with the true graph (which was used in step 1 to generate the cancer cell data) yielding the four performance measures Diff, PFD, PND and FPF. The process illustrated here was repeated 20 times for all possible combinations of Model, sh, True Graph, S.Time, S.Type, S.Size. Every data set was subject to all Filtering procedures and analyzed with all six Methods.
