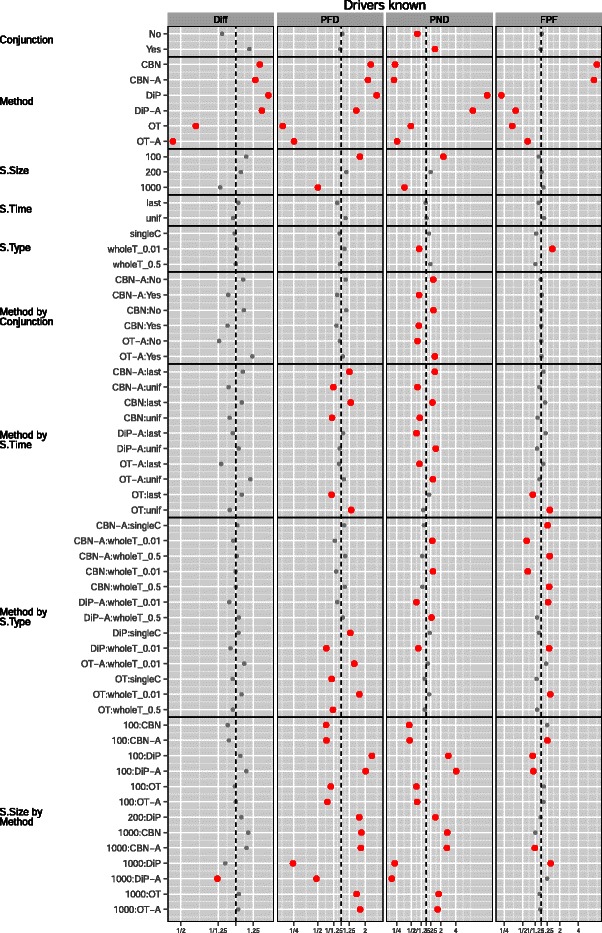
Figure 2.

Drivers known, plot of the coefficients (posterior mean and 0.025 and 0.975 quantiles) for Conjunction, Method, S.Time, S.Type and S.Size from the GLMMs for each performance measure. X-axis labeled by the exponential of the coefficient (i.e., relative change in the odds ratio or in the scale of the Poisson parameter for Diff): smaller (or lefter) is better. The vertical dashed line denotes no change relative to the overall mean (the intercept). The x-axis has been scaled to make it symmetric (e.g., a ratio of 1.25 is the same distance from the vertical line as a ratio of 1/1.25). Coefficients that correspond to a change larger than 25% (i.e., r a t i o>1.25 or <1/1.25) shown in larger red dots. The coefficients shown are only those that represent a change larger than 25% for at least one performance measure, or coefficients that are marginal to those shown (e.g., any main effect from an interaction that includes it).
