
Figure 3.
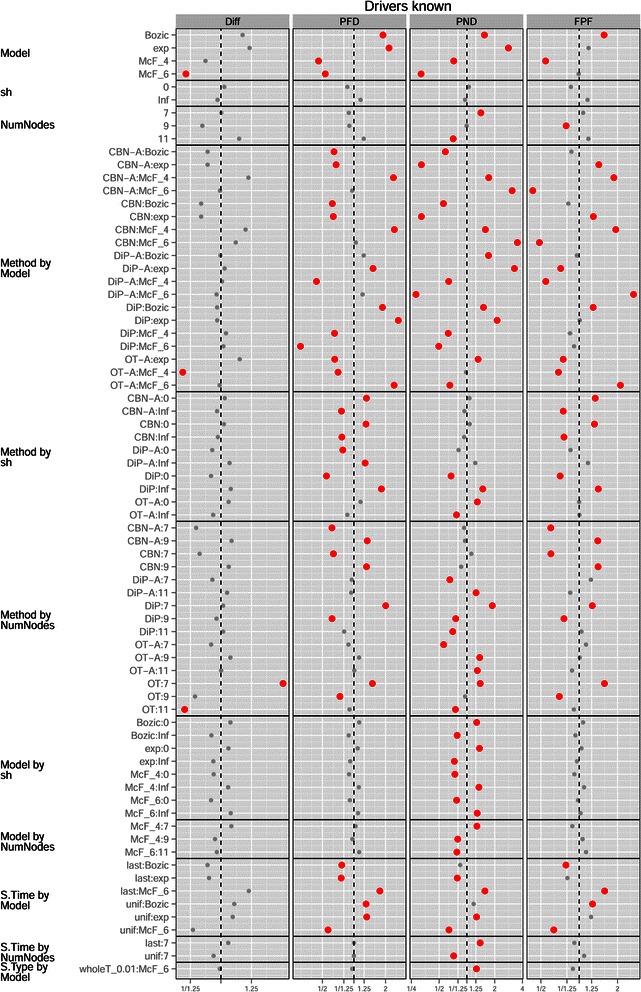
Drivers known, plot of the coefficients model, sh, Graph,and their interactions with all other terms from the GLMMs for each performance measure. See legend for Figure 2.
Official websites use .gov
A
.gov website belongs to an official
government organization in the United States.
Secure .gov websites use HTTPS
A lock (
) or https:// means you've safely
connected to the .gov website. Share sensitive
information only on official, secure websites.
Drivers known, plot of the coefficients model, sh, Graph,and their interactions with all other terms from the GLMMs for each performance measure. See legend for Figure 2.