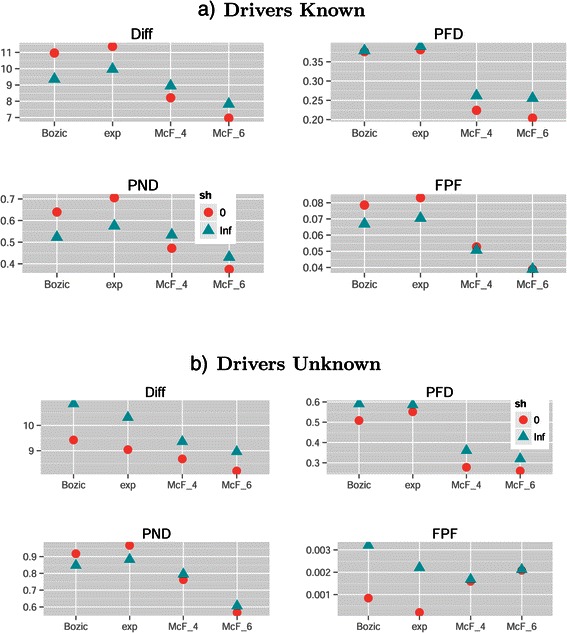
Figure 7.

Mean of each performance measure for the different combinations of model and sh in (a) the drivers known and (b) the drivers unknown scenarios. Each value shown is the mean of 12960 and 51840 values for drivers known and unknown, respectively.
