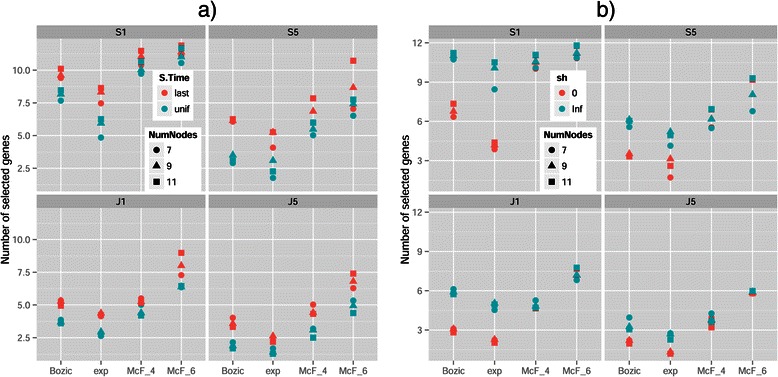
Figure 8.

Mean number of genes selected for the different combinations of model and filter by (a) S.Time and (b) sh. Different symbol shapes identify the number of true nodes (NumNodes) of the true graph. Note that the number of genes selected is a function of Filtering, not Method. Each value shown is the mean of 720 values.
