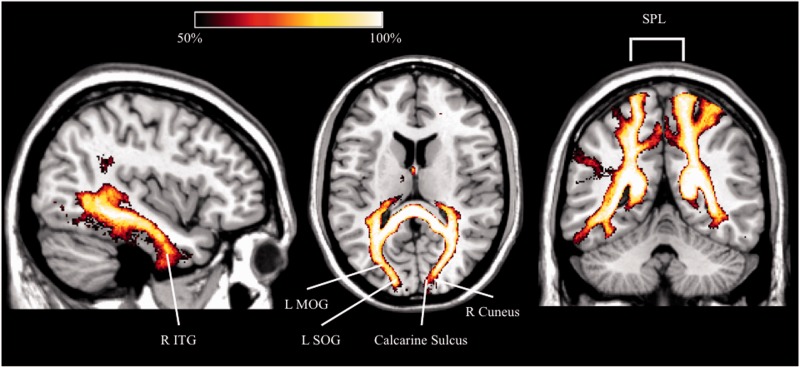
Figure 5.
Results of TBSS. Percentage map in healthy subjects (n = 40) showing the cortical projections of the splenial voxels (forceps major) identified by TBSS analysis in chronic neglect patients compared to non-neglect patients. L = left; MOG = middle occipital gyrus; R = right; SOG = superior occipital gyrus; SPL = superior parietal lobule; ITG = inferior temporal gyrus.

