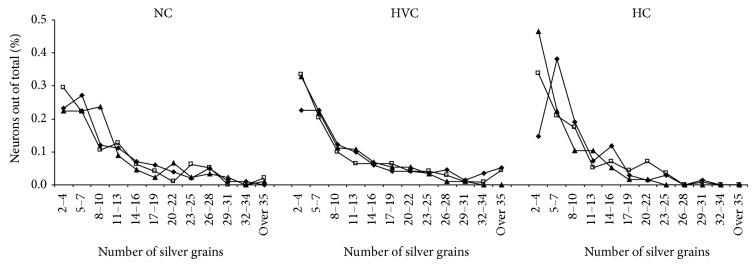
Figure 8.

Distributions of the number of exposed silver grains in [3H]-thymidine+ neurons in NC, HVC, and HC, in brains of birds from the control group (♦; n = 7), 1 M (one month after BrdU treatment; □; n = 7), and 3 M (three months after BrdU treatment; ▲; n = 6).
