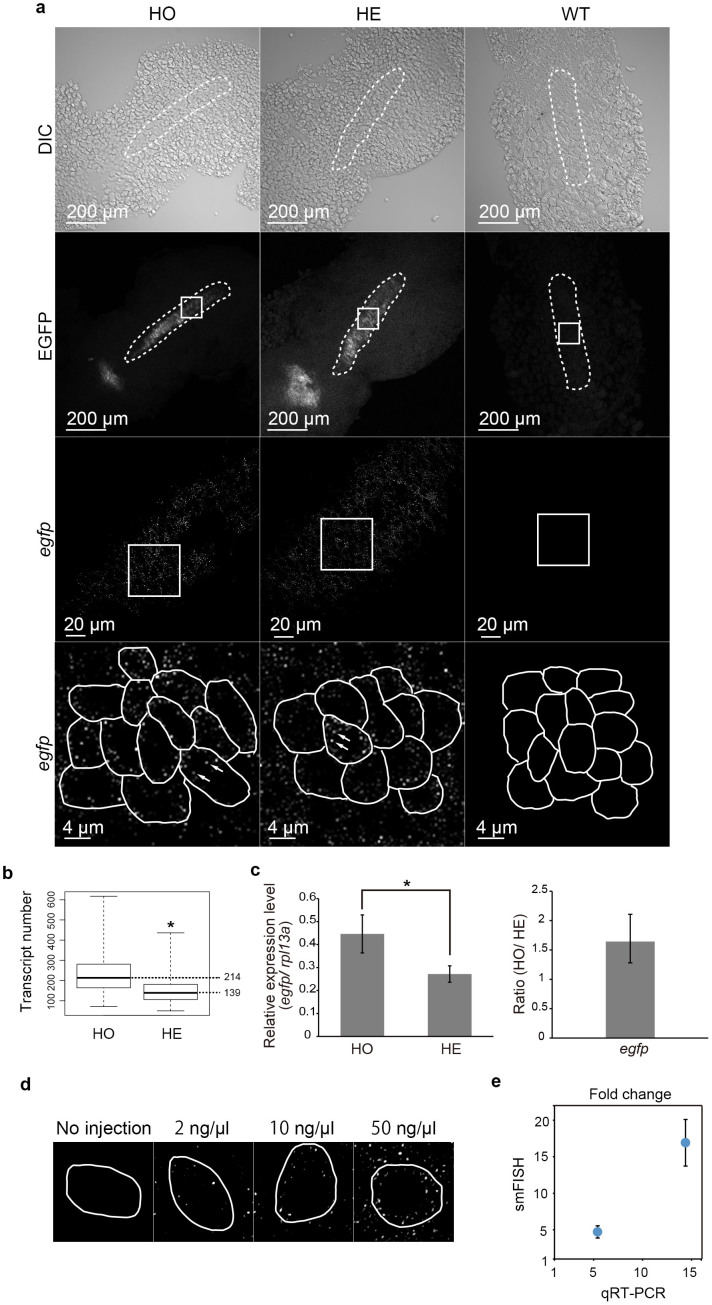
Figure 1. Validation of whole-mount smFISH protocol using a transgenic reporter line.
(a) Results for homozygous (HO) and hemizygous (HE) Tg(olig2:egfp) transgenic and wild type (WT) zebrafish embryos are shown. The intact embryo was imaged by confocal microscopy. Shown are images of DIC (top row), EGFP fluorescence (second row) and the images of hybridization with the probe set for egfp conjugated with TAMRA (third and bottom rows). The smFISH hybridization images (third row) are those boxed in the EGFP fluorescence images (second row). Higher magnifications (bottom row) are filtered and threshold applied single plane fluorescent confocal images and correspond to the boxed areas in the lower magnification hybridization images (second and third rows). Individual cells are outlined by white enclosing lines in the higher magnification of the hybridization images and representative dot-like signals are indicated by arrows (bottom row). (b) Box plots showing the egfp transcript number. *p = 2.5e-16 (t-test). Mean values for each genotype are indicated on the right. (c) Quantitative real-time PCR for egfp in homozygous (HO) and hemizygous (HE) Tg(olig2:egfp) embryos. The level of egfp transcripts was normalized to those of rpl13a and shown as relative expression level. *p = 0.001081 (t-test). Data are shown as mean ± s.d. (d) Single plane fluorescent confocal images, each showing a representative cell from an uninjected and an embryo injected with 1nl of 2 ng/μl, 10 ng/μl, 50 ng/μl of in vitro transcribed egfp RNA. Individual cells are indicated by white enclosing lines. (e) A graph showing the linear correlation between the fold increases of the injected egfp RNA present in individual cells as determined by qRT-PCR and the fold increases of the number of fluorescent dots in individual cells.

