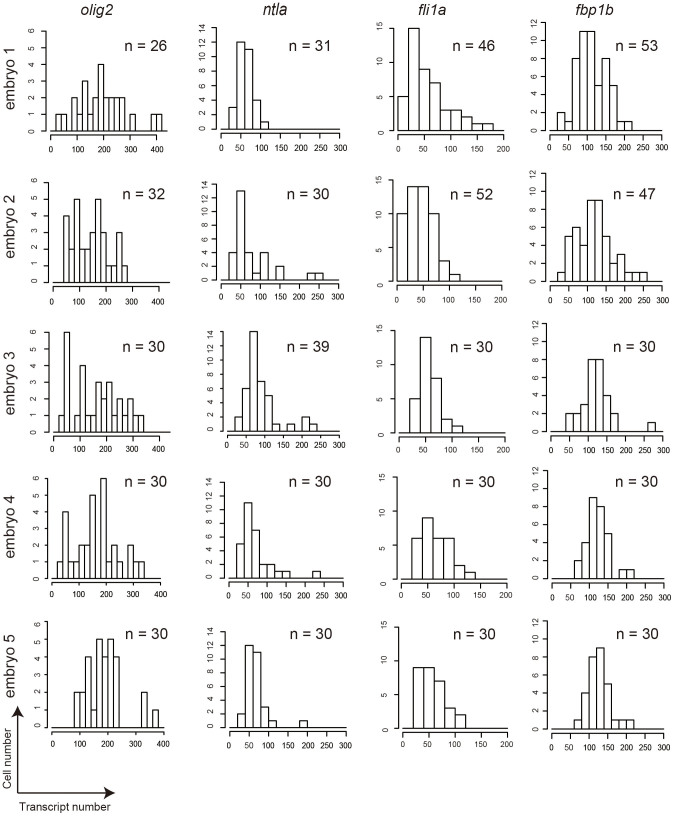
Figure 4. Probability distributions of the transcript number for each gene in individual cells.
Histograms of the transcript number for each gene (olig2, ntla, fli1a, fbp1b) in individual cells from five different embryos (embryos 1, 2, 3, 4, 5). A total number (n) of cells counted for each gene are indicated in each histogram.

