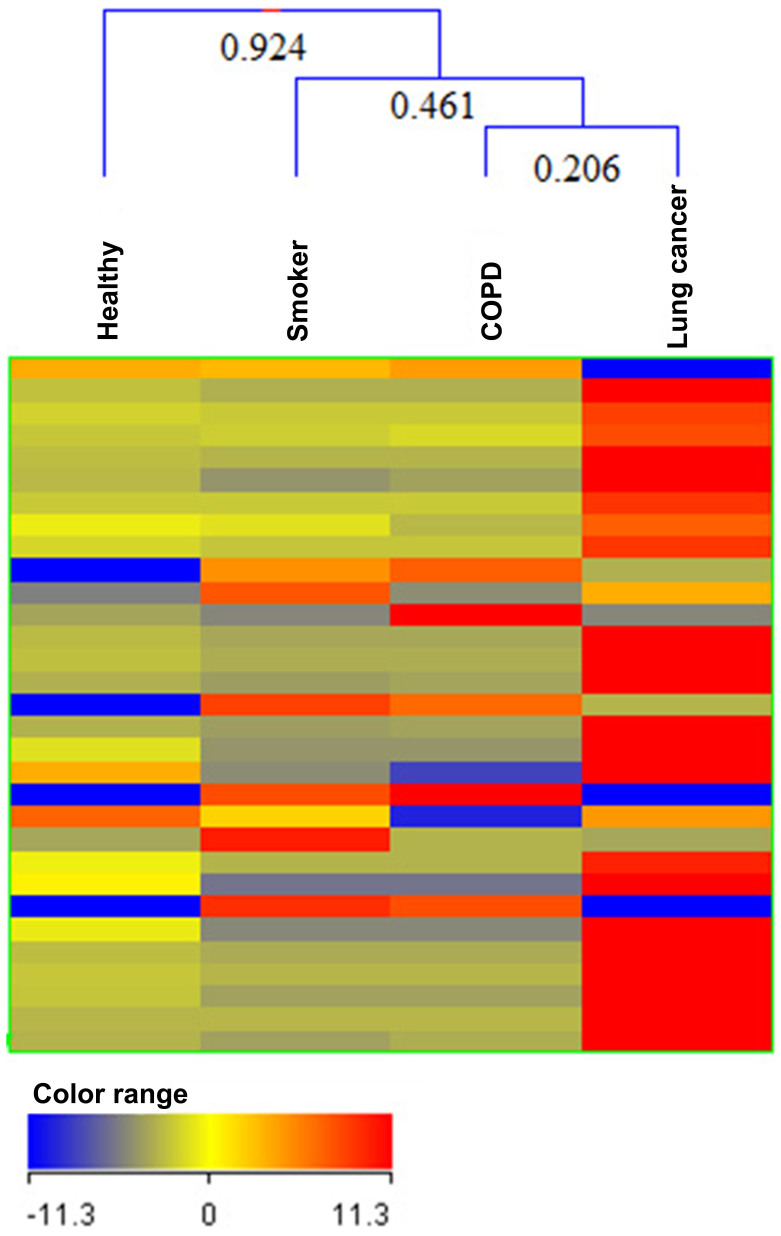
Figure 2. Comparison of four groups of samples i.e. healthy non-smokers (NS), smokers (S), Chronic Obstructive Pulmonary Disease (COPD) and Lung Cancer (LC) patients using normalized intensities of thirty two significance metabolites.
The dendrogram was produced by applying a hierarchical clustering algorithm (Pearson's uncentered-absolute distance metric, Complete Linkage).

