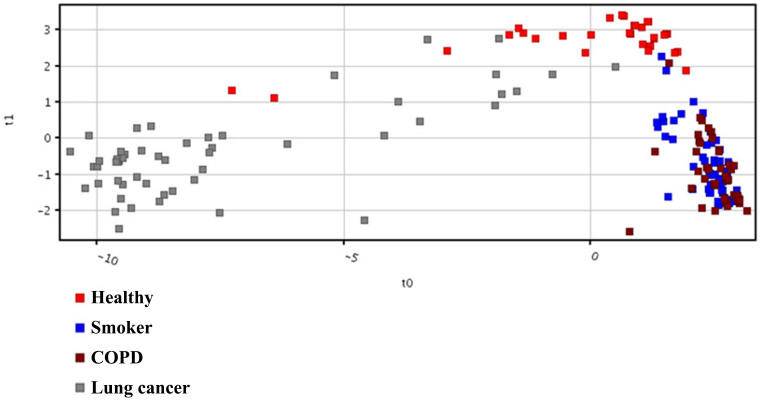
Figure 4. PLS-DA Scores scatter plots discriminating among controls and lung cancer patients based on the thirty two significantly differentiate metabolite profiling data.
The red, blue, brown and gray squares indicate healthy volunteers (n = 54), smokers (n = 66), COPD (n = 75) and lung cancer patients (n = 52), respectively.

