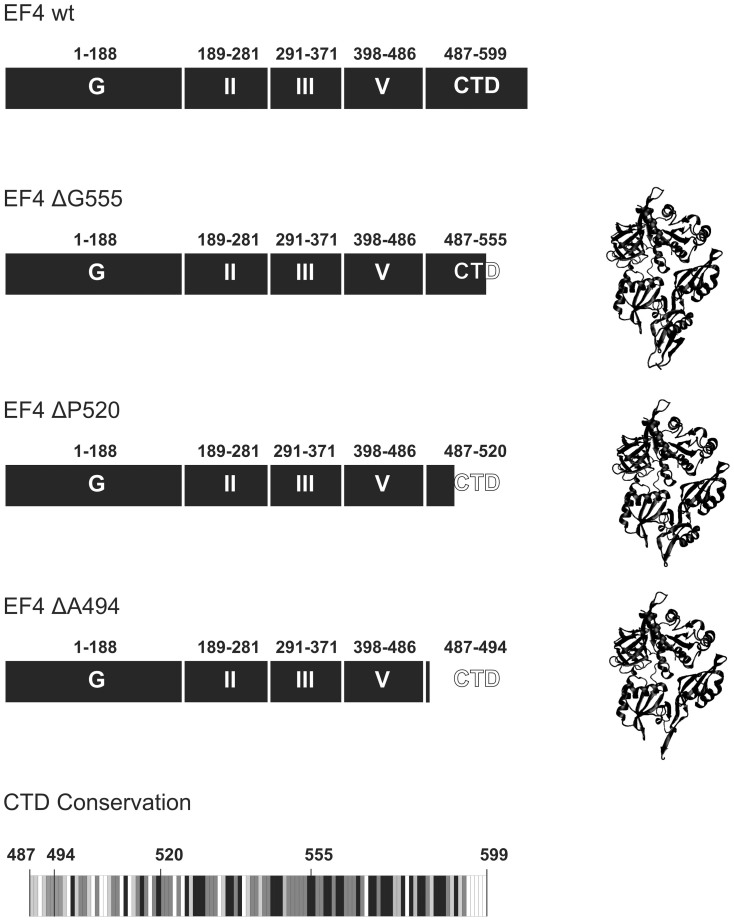
Figure 1. EF4 C-terminal truncation variants.
Structural models corresponding to EF4 ΔG555, EF4 ΔP520 and EF4 ΔA494 are represented in cartoon based on the available X-ray crystallographic structure (PDB ID 3CB46). Conservation of the C-terminal domain of EF4 is given as grey scale representation including the position of the three truncations. Black indicates 100%, dark grey 80–100%, light grey 60–80% and white < 60% conservation (Supplemental sequence alignment).

