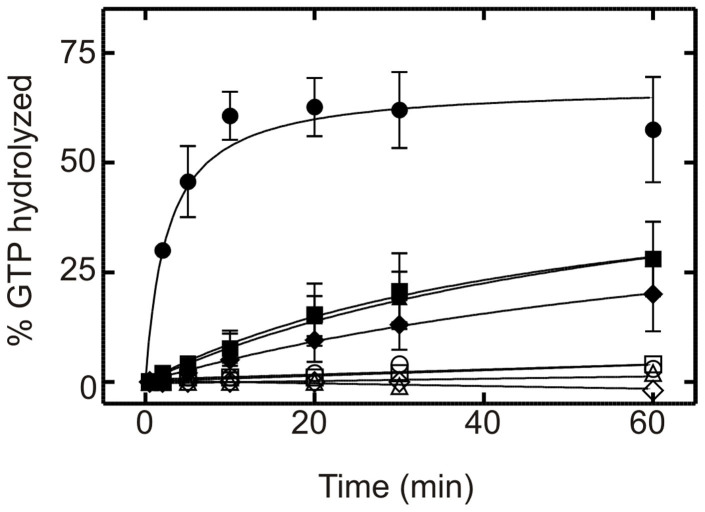
Figure 6. Inhibition of 70S stimulated GTPase activity of EF4 by thiostrepton.
GTP hydrolyzed is plotted as a function of time. Samples consisted of 5 μM EF4 wild type ( ), EF4 ΔA494 (
 ), EF4 ΔP520 (
 ) and EF4 ΔG555 (
 ) in the presence of 70S (0.1 μM). Open symbols represent the respective GTPase activity in the presence of thiostrepton (10 μM).

