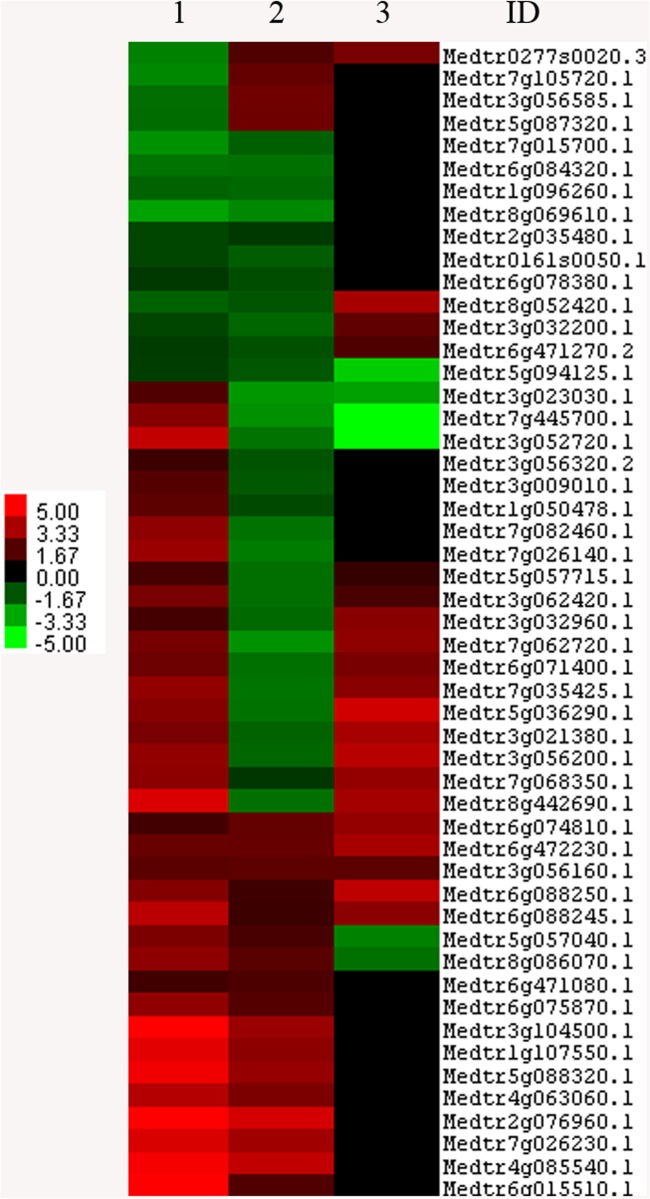
Fig 3. Differentially expressed genes found in both cultivars (common genes).
1: cv. Lahontan. 2: cv. Moapa. 3: basal ratio Moapa/Lahontan. ID: M. truncatula gene ID. Color code is shown to indicate up and-down-regulated genes (red and green, respectively). Clustering was done with Claster.3.0 software [37]. Visualization performed with Java Treeview [38].

