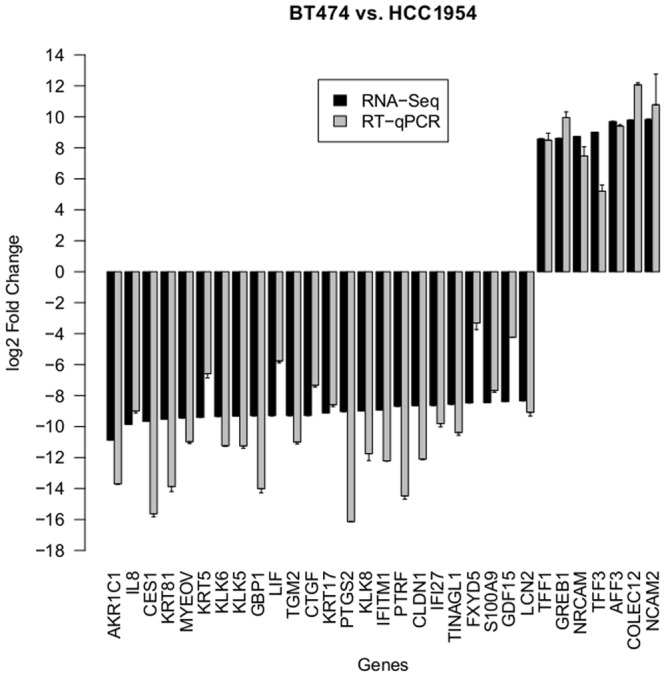
Fig 5. Fold Changes of DE genes (BT474 vs. HCC1954).

The barchart displays the log2 fold changes of validated candidate genes, which showed significant differences in their expression in BT474 and HCC1954, respectively. Positive values indicate an upregulation in BT474. Negative values indicate an upregulation in HCC1954. Black bars denote values resulting from RNA-Seq analysis. Gray bars denote values resulting from RT-qPCR analysis.
