Figure 6.
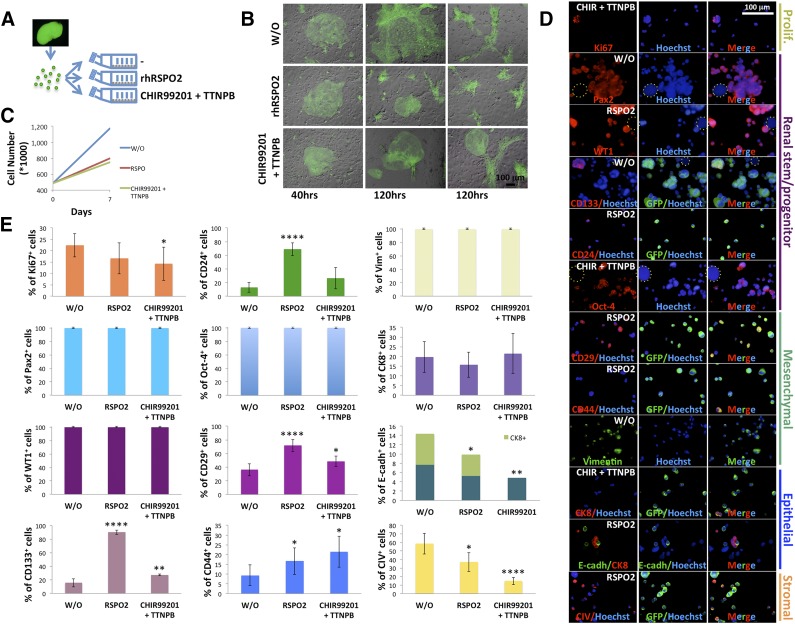
In vitro expansion of mouse renal progenitor cells. (A): Schematic diagram illustrating culture of freshly isolated GFP+ embryonic kidney cells. Briefly, after isolation, single embryonic kidney cells were added to T25 flasks containing a confluent feeder layer and treated with or without 100 ng/ml RSPO2 or a combination of 3 μM CHIR99021 and 1 μM TTNPB. (B): Merged GFP and bright-field images of embryonic kidney cells growing on feeder layers under different culture conditions at 40 and 120 hours. (C): Line graph showing embryonic kidney cell numbers after a 7-day treatment with or without RSPO2 or CHIR99021/TTNPB. (D): Representative immunocytochemical stainings for Ki67, Pax2, WT1, CD133, CD24, Oct-4, CD29, CD44, vimentin, CK8, E-cadh, or CIV on embryonic kidney cells after a 7-day treatment as in (C) (only one treatment is shown for each marker; dotted circles indicate feeder cells). (E): Bar graphs showing the frequency of markers in embryonic kidney cells after a 7-day treatment as in (C) (for each marker, percentages of positive cells were determined by averaging up to 14 different randomly selected ×20 microscopic fields of immunocytochemical stainings). ∗, p < .05; ∗∗, p < .01; ∗∗∗, p < .001; ∗∗∗∗, p < .0001. Abbreviations: CHIR, CHIR99021; CIV, collagen IV; CK8, cytokeratin-8; E-cadh, E-cadherin; GFP, green fluorescent protein; hrs, hours; Oct-4, octamer-4; Pax2, Paired box gene 2; Prolif., proliferation; RSPO2, R-Spondin 2; Vim, vimentin; W/O, control; WT1, Wilms’ tumor.

