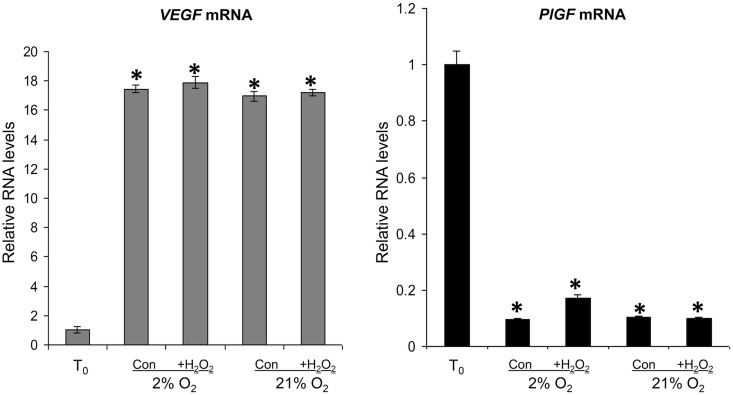
Figure 5.
VEGFA and PlGF mRNA in T0 controls (T0), and in explants cultured under 2 or 21% O2 ± 1 mM H2O2 for 6 h. RNA was isolated and relative levels of VEGFA and PlGF mRNA were detected using quantitative real-time RT–PCR. VEGFA and PlGF mRNA levels were normalized to the 18S RNA levels. Significant differences (P < 0.05) are: * versus T0 controls (one-way ANOVA + Student–Newman–Keuls test).

