
Figure 3.
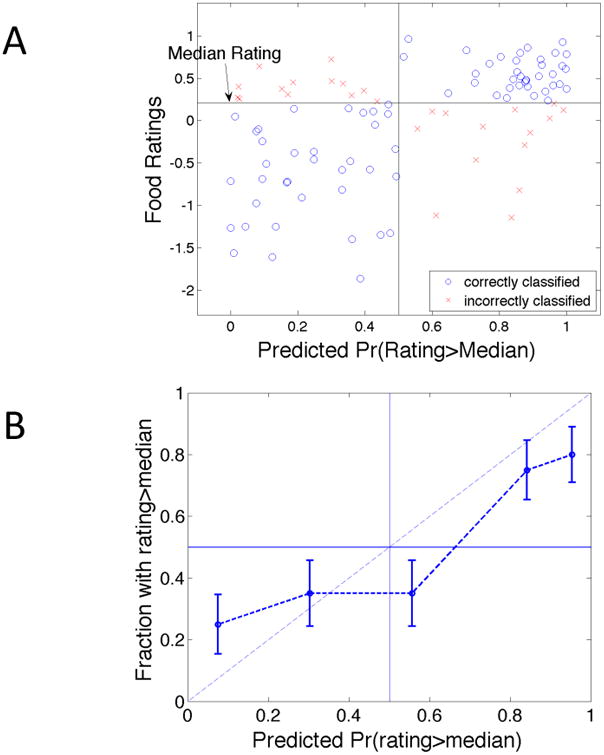
Predicting above-and-below-median ratings for new items within groups.
Notes: (A) Scatter plot of mean ratings versus predicted probability that item is in the upper half of the group's valuation distribution. Circles denote correct predictions. Crosses denote incorrect predictions. (B) Fraction of items with ratings exceeding the median versus average predicted probability of rating exceeding the median, grouped by quintiles of the latter.