
Figure 4.
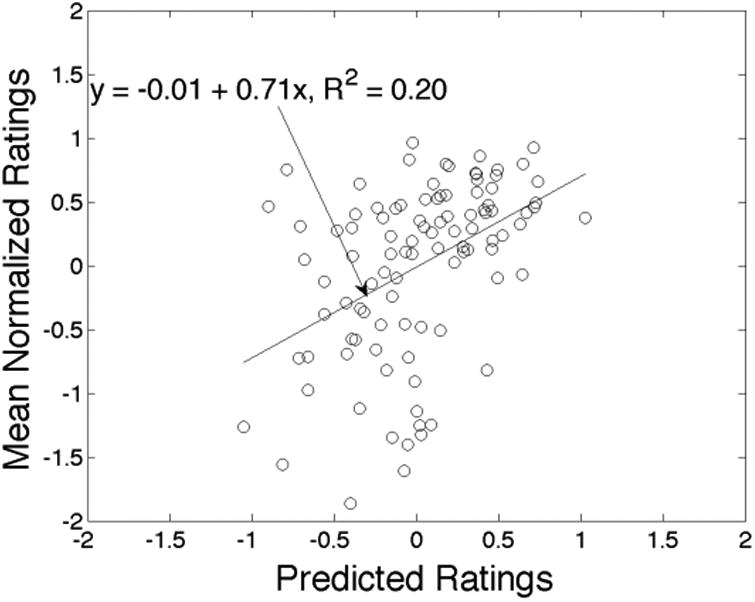
Predicting average ratings for new items within groups.
Notes: Scatter plot of actual vs. predicted mean normalized ratings for each item. Each point represents a different food item. Least-squares regression line included.
Official websites use .gov
A
.gov website belongs to an official
government organization in the United States.
Secure .gov websites use HTTPS
A lock (
) or https:// means you've safely
connected to the .gov website. Share sensitive
information only on official, secure websites.
Predicting average ratings for new items within groups.
Notes: Scatter plot of actual vs. predicted mean normalized ratings for each item. Each point represents a different food item. Least-squares regression line included.