
Figure 5.
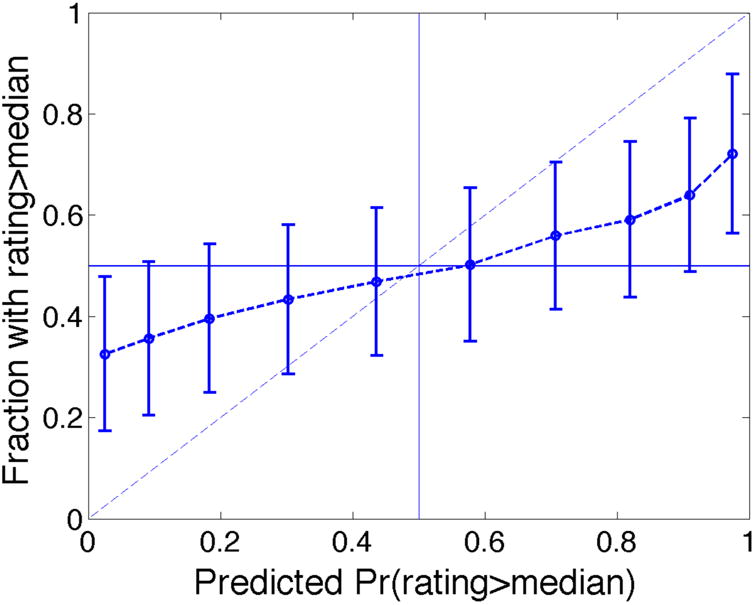
Predicting above-and-below-median average ratings for new items and new groups.
Notes: Fraction of items with ratings exceeding the median versus average predicted probability of rating exceeding the median, grouped by deciles of the latter. Standard errors computed via bootstrap over the 200 population draws.