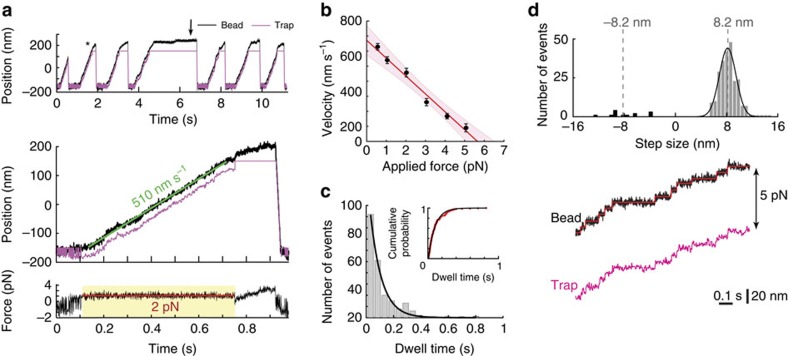
Figure 4. Single-molecule function of MD-ΔCT.
(a) Bead movement under constant load (optical trap force clamp). Top: repeated bead displacements by single motors (black). The trap (magenta) follows at a fixed distance to apply a constant force (here, 2 pN). When the bead travels beyond the region of force-clamp operation, it either stalls (black arrow) or detaches. Bottom: detail of the event marked by an asterisk in the top panel, fit with a line to measure the mean velocity (~510 nm s−1). The lower inset shows the applied force, which was held constant at 2.1±0.3 pN (mean±s.d.) during force-clamp operation (yellow region). (b) Velocity versus force. Points are means of repeated measurements under constant force, including only runs ≥50 nm. Error bars span 95% CIs of the mean. The red line is a weighted linear fit (V=672 nm s−1−119 nm s−1 pN−1 × F), with shaded region of 95% confidence that intercepts the abscissa at (575, 769) nm s−1 and the ordinate at (5.1, 6.5) pN. Data are from six beads over two experiments (N=38–233 at each force; 655 events total). (c) Histogram of dwell times between consecutive forward steps under 5 pN load. An exponential fit, y=A exp(−kcat t), gives kcat =12.1 s−1; 95% CI (10.2, 13.9) s−1. Inset: empirical cumulative probability density function, with fit y=1−exp(−kcat (t−tL)), where tL is the dwell time detection limit (~6–8 ms) and kcat =10.6 s−1 (95% CI (10.4, 10.8) s−1). Data from four beads over three separate experiments (211 events). (d) Top: histogram of step sizes under 5 pN load (N=254). Grey and black bars represent forward (95% of steps) and backward steps, respectively. A Gaussian fit (black curve) to the forward steps yields 8.2±1.3 nm (mean±s.d.; 95% CI’s (8.0, 8.4) and (1.1, 1.5) nm, respectively). Backward steps were 7.8±2.7 nm (mean±s.d.). Bottom: example trace showing steps (red line) identified by a step-finding algorithm (see Methods). ATP concentration was 1 mM. Experiments were performed with AC-purified protein.

