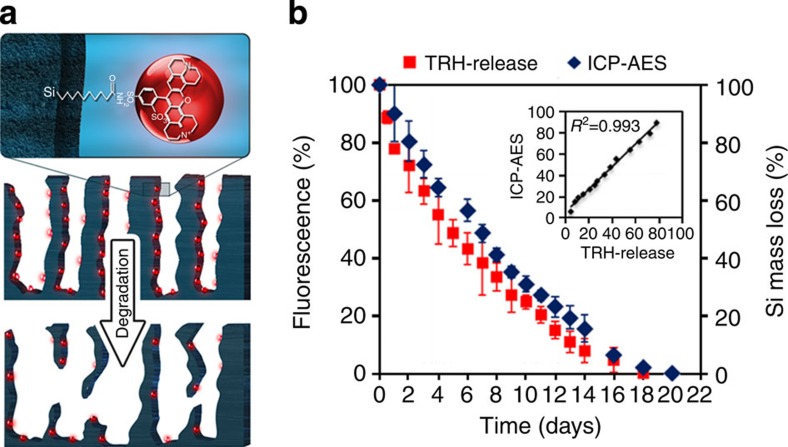
Figure 1. Degradation of TRH-labelled PSi microparticles.
(a) Schematics of the degradation process of TRH-labelled PSi microparticles and (b) in vitro Si degradation profiles measured by ICP-AES (blue) and TRH fluorophore release (red). Data are the average percentage±s.d of three independent experiments. Note: the porous nanostructure is characterized by a morphology of interconnecting cylindrical pores that is not reflected in the schematic representation of the PSi.

