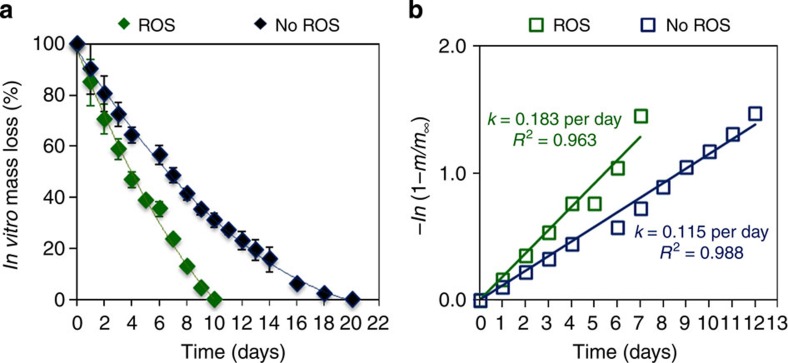
Figure 4. In vitro Si mass loss kinetics of TRH-PSi microparticles under physiologically relevant levels of ROS.
(a) In vitro Si mass loss profiles measured by ICP-AES in PBS buffers with ROS (green) and without ROS (blue) and (b) corresponding calculated erosion rates. Data are the average percentage±s.d of three independent experiments. Both environments show a logarithmic degradation (that is, increase in Si content in the aqueous environment), with a rate of k=0.183 per day for ROS solution and k=0.115 per day for PBS buffer.

