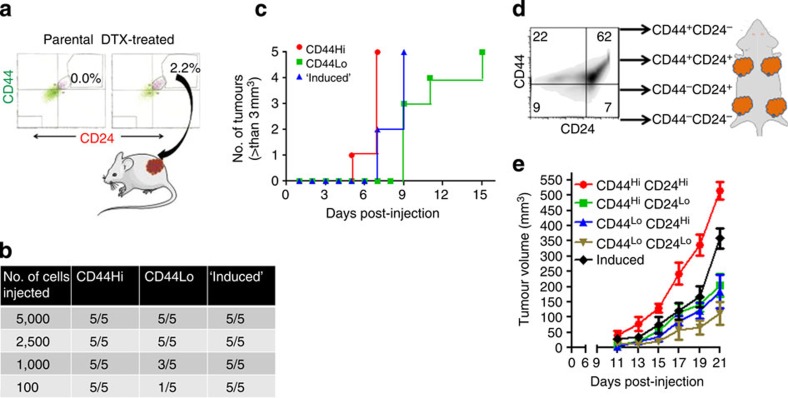
Figure 5. In vivo characterization of the tumorigenic property of chemotherapy-induced CD44HiCD24Hi cells.
(a) Schematic shows the selection of ‘induced’ CD44Hi CD24Hi phenotype from 4T1 mammary carcinoma cells sorted by FACS. Cells that emerge de novo with a CD44Hi CD24Hi phenotype following chemotherapy treatment (50 nM docetaxel, 24 h) (~2.2% of the population that was not originally present in the parent population were considered an ‘induced’ subset. (b) Table shows the tumorigenicity of different subsets of breast cancer cells isolated on the basis of CD44, CD44 expression levels compared with the induced subset. Tumorigenicity was quantified by implanting different cell numbers in mice and monitoring the number of tumours developed. (c) Graph shows the temporal kinetics of tumour growth initiated from seeding CD44Hi, CD44Lo or induced cells. (d) Schematic illustrates experimental design of in vivo kinetic analysis of tumour growth of distinct subpopulations. Cells were isolated from each quadrant and an equal number of cells were implanted in mice in separate areas. An induced CD44HiCD24Hi group was run in parallel. (e) Graph shows tumour volumes from indicated phenotypic subsets over time. Data shown are mean±s.e.m., n=4.

