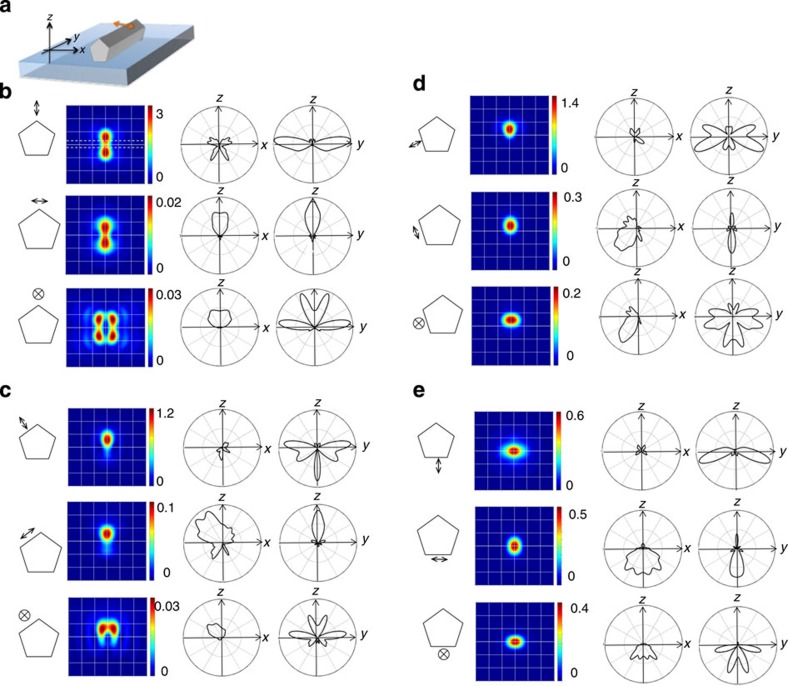
Figure 4. Simulated fluorescence PSFs for single molecules on Ag nanowires.
(a) Sketch of the simulation geometry, the double-headed arrow indicates the position and orientation of the oscillating electric point dipole that simulates a single fluorophore in the vicinity of the nanowire (~280 nm diameter). (b–e) Far left: the position and orientation of the point dipole (indicated by the double-headed arrow) relative to the pentagonal cross section of the silver nanowire. Left centre: the simulated far-field emission PSF colour map for the point dipole imaged in the sample plane (nanowire edges indicated by dashed lines in (b), top colour map). The image size is 3 × 3 μm2. Right centre: polar plot of the angular dispersion of point dipole emission in the xz plane, Far right: polar plot of the angular dispersion of the point dipole emission in the yz plane.

