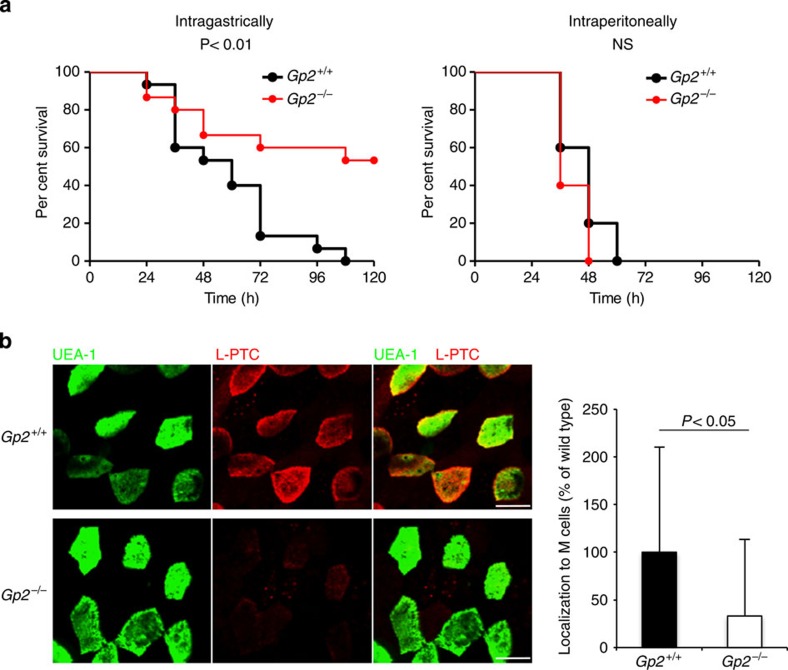
Figure 6. L-PTC is taken up by M cells via the GP2–HA interaction.
(a) Gp2+/+ or Gp2−/− mice were inoculated intragastrically (1.33 pmol: 1.0 μg) or intraperitoneally (0.067 fmol: 50 pg) with L-PTC (intragastrically, n=15 per group; intraperitoneally, n=5 per group). Statistical analyses were performed with the log-rank test. (b) Alexa Fluor 568-labelled L-PTC (red) were injected into ligated mouse intestinal loops and incubated for 1 h. PPs removed from Gp2+/+ or Gp2−/− mice were incubated with FITC-labelled UEA-1 (green). Images from FAE regions were analyzed quantitatively using the MetaMorph software. The data are expressed as percentages of the level in Gp2+/+ mice. Error bars indicate s.d. For each group, six different PPs obtained from three different mice were examined (Gp2+/+, 127 cells; Gp2−/−, 161 cells). Statistical analyses were performed with Mann–Whitney U-test. Scale bar, 10 μm. NS, not significant.

