Figure 1.

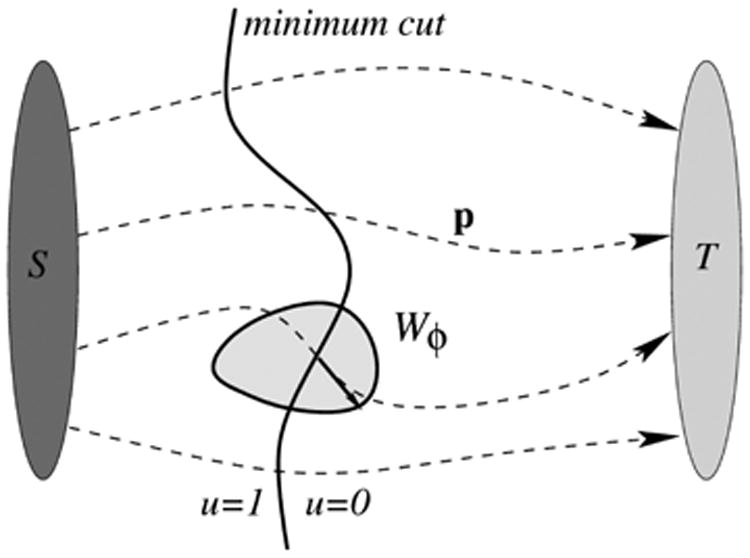
Basic illustration of the anisotropic continuous maximal flow approach. The minimum cut separating the source S and the sink T, the flow field p, and one anisotropic capacity constraint Wϕ (convex shape) are depicted.

Basic illustration of the anisotropic continuous maximal flow approach. The minimum cut separating the source S and the sink T, the flow field p, and one anisotropic capacity constraint Wϕ (convex shape) are depicted.