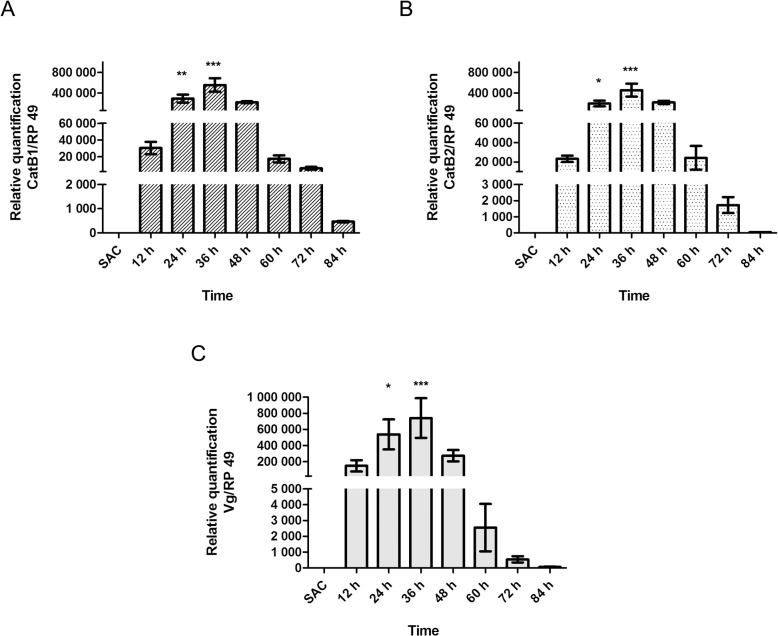
Fig 4. Assessment of vitellogenin and CatB1 and CatB2 transcript levels during Cx. quinquefasciatus vitellogenic process.
Quantitative real-time PCR was used to examine the transcript levels of CatB1 (A), CatB2 (B), and vitellogenin (Vg; C) of females fed on sucrose (SUC) and every 12 h PBM (12, 24, 36, 60, 72, 84). Each column represents the mean expression ± standard error of three independent biological replicates; asterisks denote data with a statistically significant differences compared to the standard condition (SUC), as determined by one-way ANOVA (*: p < 0.05; **: p <0.001; ***: p < 0.001) and the Tukey's HSD (Honestly Significant Difference) test.

