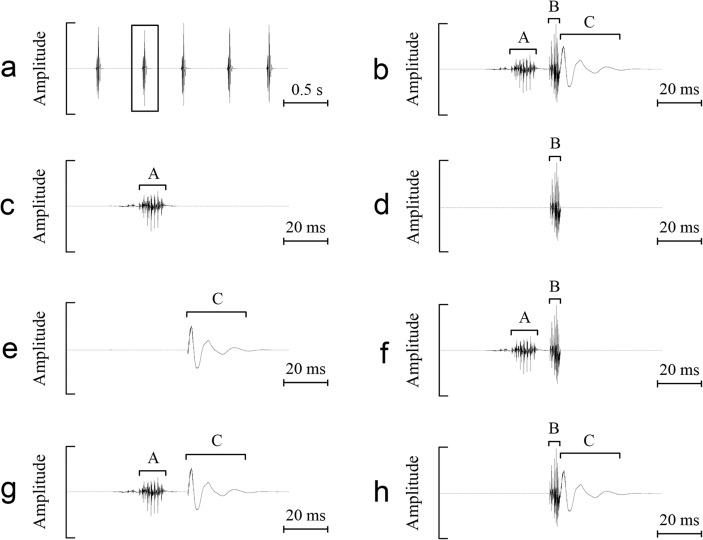
Fig 3. Acoustic playback stimuli.
(a) Oscillogram of a part of stimulus ABC. (b) Detailed oscillogram of a female sound marked by the box in a. (c, d, and e) Detailed oscillograms of a modified female sound included in stimulus A, B, and C, respectively. (f, g, and h) Detailed oscillograms of a modified female sound included in stimulus AB, AC, and BC, respectively.

